

【Master RCI to Win!!】 Trend Reversal USD/JPY 1-minute chart mBDSR signal
0
【Mastering RCI!! Trend reversal, pullback buying, and pullback selling】
Indicator【BODSOR・mBDSR】that excels when used in combination with RCI
and techniques, case studies (PDF) ★GogoJungle AWARD2020 winner★
https://www.gogojungle.co.jp/tools/indicators/11836
This product【BODSOR・mBDSR】includes over 550 PDFs as techniques and case studies (total over 1,950 pages, over 1,900 charts, over 690,000 characters).
About the PDFs included in the above product
358 PDFs included with【BODSOR・mBDSR】
https://www.gogojungle.co.jp/finance/navi/articles/34271
Aまとめ of PDFs explaining the mBDSR (Moving Average Filter) and RCI three-line combo
https://www.gogojungle.co.jp/finance/navi/articles/90127
【Mastering RCI and Winning!!】PDF collection for trades using 5-minute signals (Day Trading)
https://www.gogojungle.co.jp/finance/navi/articles/89870
【Mastering RCI!!】PDF collection for short-term 1-minute trades (Scalping)
https://www.gogojungle.co.jp/finance/navi/articles/88762
【Mastering RCI!!】PDF collection for 15-minute trades
https://www.gogojungle.co.jp/finance/navi/articles/113513
【Mastering RCI!!】PDF collection explaining profit-taking points
https://www.gogojungle.co.jp/finance/navi/articles/89471
PDF collection to effectively utilize R1R2S2【Mastering RCI!!】
https://www.gogojungle.co.jp/finance/navi/articles/93154
【Mastering RCI!!】PDF collection to effectively use the MT5 version of mBDSR
https://www.gogojungle.co.jp/finance/navi/articles/84918
Below, we introduce examples of signals formBDSR (two RCI filters)signals.
USDJPY 1-minute chart
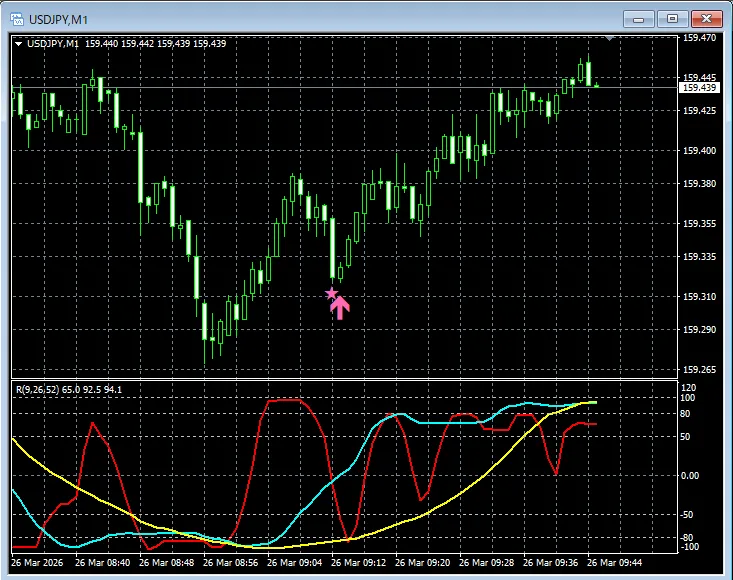
In the chart above,the signals of mBDSR (two RCI filters)light up at timely moments.
In the case of the Moving Average Filter mBDSRas well,when combined with a top-down approach using the three-line RCI,it enables high-probability trades. Explanations for this are alsoin the included PDF.
Note: For convenience, some charts in this article have annotations such as circles, straight lines, or rectangles.
Indicator【BODSOR・mBDSR】that excels when used in combination with RCI
and techniques, case studies (PDF) ★GogoJungle AWARD2020 winner★
https://www.gogojungle.co.jp/tools/indicators/11836
Includes over 550 PDFs (techniques and case studies: total over 1,950 pages, over 690,000 characters).
Many of these areexamples detailing how to logically link higher and lower timeframes using three RCI lines, gradually analyzing multiple lower-timeframe conditions, and ultimately waiting for pullbacks or pullback sells in the lower timeframes via mBDSR signals..
Additionally,these emphasize capturing points where multiple entry grounds overlap..
Also included is a method to explore upside and downside targets using three-line RCI.
In the PDF explanationsover 1,900 charts are used..

Blacksun's Indicators (List)
https://www.gogojungle.co.jp/finance/navi/articles/33779
Blacksun's free indicators and free eBooks
https://www.gogojungle.co.jp/finance/navi/articles/90181
【Reference videos (RCI and mBDSR related)】
Environment recognition and multi-timeframe analysis to wait for signals using RCI (Part 1)
https://www.youtube.com/watch?v=1prvET_M5mA
Environment recognition and multi-timeframe analysis to wait for signals using RCI (Part 2)
https://www.youtube.com/watch?v=vR4oD-oMVQQ
Environment recognition and multi-timeframe analysis to wait for signals using RCI (Part 3)
https://www.youtube.com/watch?v=C6DHn0lD-I4
Environment recognition and multi-timeframe analysis to wait for signals using RCI (Part 4)
https://www.youtube.com/watch?v=QG1iNTnLyyQ
Environment recognition and multi-timeframe analysis to wait for signals using RCI (Part 5)
https://www.youtube.com/watch?v=VYlGiy6Cllg
× ![]()


Is it OK?