

【Master RCI and win with a moving average filter!!】USD/JPY 30-minute chart mBDSR signal
【Master RCI!! Trend Reversal, Buy on Dips, Sell on Rallies】
Indicator that shines in combination with RCI: 【BODSOR・mBDSR】
and Methods / Case Studies (PDF) ★GogoJungle AWARD2020 Winner★
https://www.gogojungle.co.jp/tools/indicators/11836
※This product【BODSOR・mBDSR】includes more than 550 PDFs (totaling over 1,950 pages, over 1,900 chart images, and over 690,000 words) as methods and case studies.
About the PDFs Included in the Above Product
About the 358 PDFs Included with 【BODSOR・mBDSR】
https://www.gogojungle.co.jp/finance/navi/articles/34271
【Master RCI to Win!!】Summary of PDFs explaining mBDSR (Moving Average Filter)
https://www.gogojungle.co.jp/finance/navi/articles/90127
【Master RCI to Win!!】Additional PDFs for Trading using 5-minute Signals (Day Trading)
https://www.gogojungle.co.jp/finance/navi/articles/89870
【Master RCI to Win!!】PDFs for Short-Term Trading on 1-Minute Chart (Scalping)
https://www.gogojungle.co.jp/finance/navi/articles/88762
【Master RCI to Win!!】Summary of PDFs Explaining Profit-Taking Points
https://www.gogojungle.co.jp/finance/navi/articles/89471
PDF Collection for Effectively Utilizing R1R2S2【Master RCI to Win!!】
https://www.gogojungle.co.jp/finance/navi/articles/93154
【Master RCI to Win!!】PDF collection for effectively utilizing MT5 version of mBDSR
https://www.gogojungle.co.jp/finance/navi/articles/84918
mBDSR (RCI Filter)andmBDSR (Moving Average Filter)have different roles. The accompanying PDFs also cover how to distinguish their uses.
Below, we introduce examples of signals formBDSR (Moving Average Filter)signals.
USD/JPY 30-minute chart
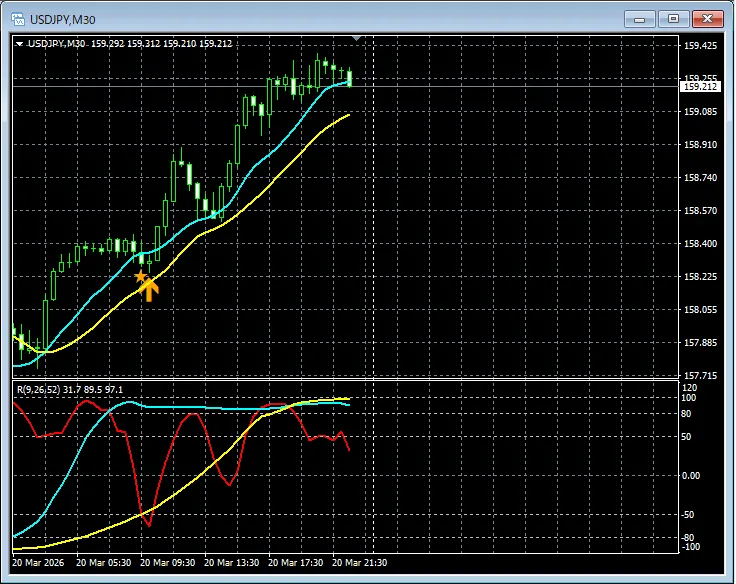
In the above chart,signals from mBDSR (Moving Average Filter)light up at timely moments.
In the case ofthe Moving Average Filter mBDSRwhen used together with RCI’s three-line top-down consolidationallows for high-profit trades. This is also explained in the attached PDFs.
※ Please note that for convenience, charts in this article may include added circles, straight lines, or rectangles.
Indicator that shines in combination with RCI: 【BODSOR・mBDSR】
and Methods / Case Studies (PDF) ★GogoJungle AWARD2020 Winner★
https://www.gogojungle.co.jp/tools/indicators/11836
Includes more than 550 PDFs (Methods & Case Studies: over 1,950 pages, over 690,000 words).
Many of these are structured as logical links between higher and lower timeframes using the RCI three-line method to sequentially examine multiple lower timeframes, ultimately waiting for dip-buying or rally-selling signals on the lower timeframe (i.e., mBDSR signals).
Also,many are focused on capturing points where multiple entry reasons align.There are also materials exploring how to explore upside/downside targets using RCI’s three-line method.
In the PDF explanations,
over 1,900 charts are used.

Blacksun's Indicators (List)
https://www.gogojungle.co.jp/finance/navi/articles/33779
About Blacksun's Free Indicators and Free E-books
https://www.gogojungle.co.jp/finance/navi/articles/90181
【Reference Videos (RCI & mBDSR Related)】
Identify signals through environment recognition and multi-timeframe analysis with RCI and guide to waiting for signals (1)
https://www.youtube.com/watch?v=1prvET_M5mA
Identify signals through environment recognition and multi-timeframe analysis with RCI and guide to waiting for signals (2)
https://www.youtube.com/watch?v=vR4oD-oMVQQ
Identify signals through environment recognition and multi-timeframe analysis with RCI and guide to waiting for signals (3)
https://www.youtube.com/watch?v=C6DHn0lD-I4
Identify signals through environment recognition and multi-timeframe analysis with RCI and guide to waiting for signals (4)
https://www.youtube.com/watch?v=QG1iNTnLyyQ
Identify signals through environment recognition and multi-timeframe analysis with RCI and guide to waiting for signals (5)
https://www.youtube.com/watch?v=VYlGiy6Cllg
× ![]()


