

Euro-dollar rebound selling signal during rapid decline [RCI three-line + mBDSR] 2019/3/22
0
※BODSOR and mBDSR are indicators developed to improve entry accuracy when performing breakout buying or pullback selling using the RCI 3-line on the 3-minute chart.
They are indicators designed to enhance the precision of entries for buying on strength or selling on pullbacks using the RCI 3-line on the 3-minute chart.
The sales page for BODSOR (mBDSR) ishere.
First, the 1-minute pullback selling signal during the initial sharp drop.
EUR/USD 1-minute chart
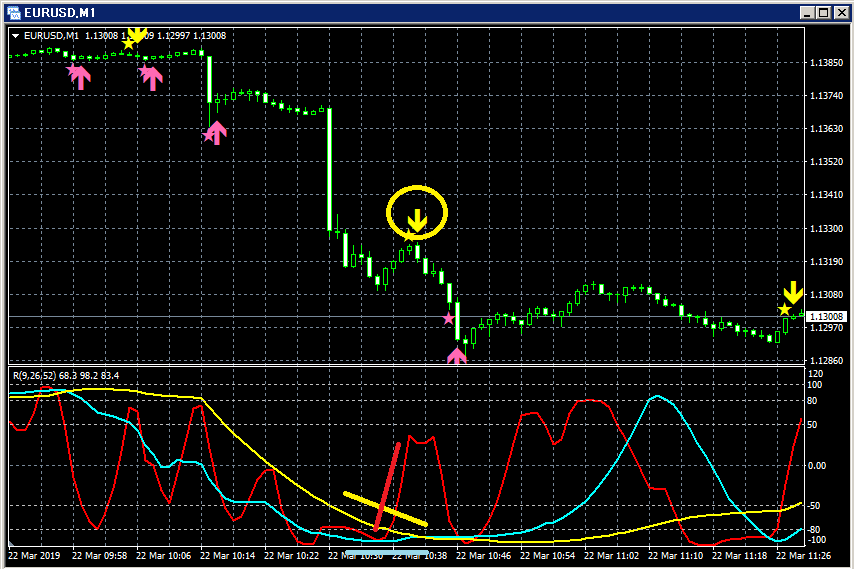
Upper row:mBDSR
Lower row: RCI 3-line (red: RCI9, light blue: RCI26, yellow: RCI52)
Next is the pullback selling signal at the 15-minute chart level after the plunge.
EUR/USD 15-minute chart
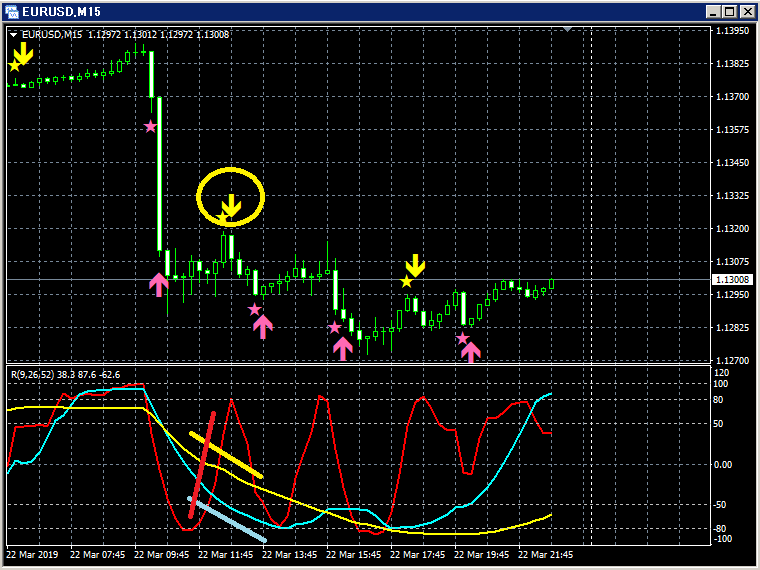
Upper row:mBDSR
Lower row: RCI 3-line (red: RCI9, light blue: RCI26, yellow: RCI52)
And then, the pullback selling signal at the 1-minute chart level after the 15-minute pullback signal lights up.
EUR/USD 1-minute chart
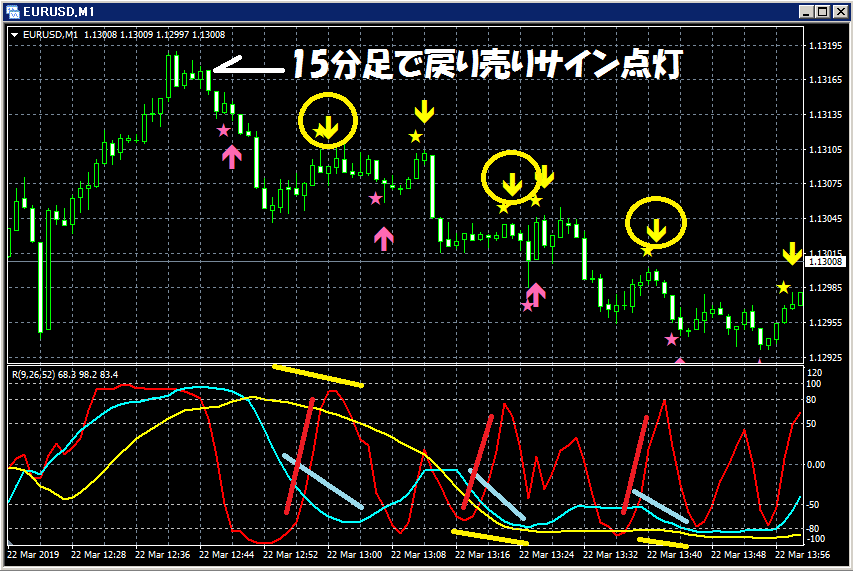
Upper row:mBDSR
Lower row: RCI 3-line (red: RCI9, light blue: RCI26, yellow: RCI52)
Among the three RCI lines, only RCI9 is clearly rising.
If RCI9 reverses and starts to decline, all three RCI lines may move downward.
In other words, price could also drop strongly.
In such a scenario, on the three upper charts, the pullback selling signal of mBDSR (yellow arrow circled) lights up, and then price starts to move downward.
The sales page for BODSOR (mBDSR) ishere.

× ![]()


