

Master RCI to Win with a Moving Average Line Filter!! AUDJPY 15-minute chart mBDSR signal
【Mastering RCI!! Trend Reversals, Buy Dips, and Sell on Retracements】
Indicator that shines in combination with RCI: 【BODSOR・mBDSR】
and Methods・Case Studies (PDF) ★GogoJungle AWARD2020 Winner★
https://www.gogojungle.co.jp/tools/indicators/11836
Note: This product【BODSOR・mBDSR】includes 550+ PDFs as methods and case studies (totaling over 1,950 pages, over 1,900 chart images, and over 690,000 characters).
About the PDFs included in the above product
About the 358 PDFs included with 【BODSOR・mBDSR】
https://www.gogojungle.co.jp/finance/navi/articles/34271
【Mastering RCI!!】 Summary of PDFs explaining mBDSR (Moving Average Filter)
https://www.gogojungle.co.jp/finance/navi/articles/90127
【Mastering RCI!!】 Additional PDFs: 5-minute chart trade (day trading) PDFs
https://www.gogojungle.co.jp/finance/navi/articles/89870
【Mastering RCI!!】 1-minute short-term trading (scalping) PDFs
https://www.gogojungle.co.jp/finance/navi/articles/88762
【Mastering RCI!!】 PDFs explaining profit-taking points
https://www.gogojungle.co.jp/finance/navi/articles/89471
PDF collection to effectively use R1R2S2【Mastering RCI!!】
https://www.gogojungle.co.jp/finance/navi/articles/93154
【Mastering RCI!!】 MT5 version of mBDSR: PDF collection
https://www.gogojungle.co.jp/finance/navi/articles/84918
mBDSR (RCI Filter)andmBDSR (Moving Average Filter)have different roles. The accompanying PDFs cover how to differentiate and use them.
Below,Introduction to the signals ofmBDSR (Moving Average Filter)
AUDJPY 15-minute chart
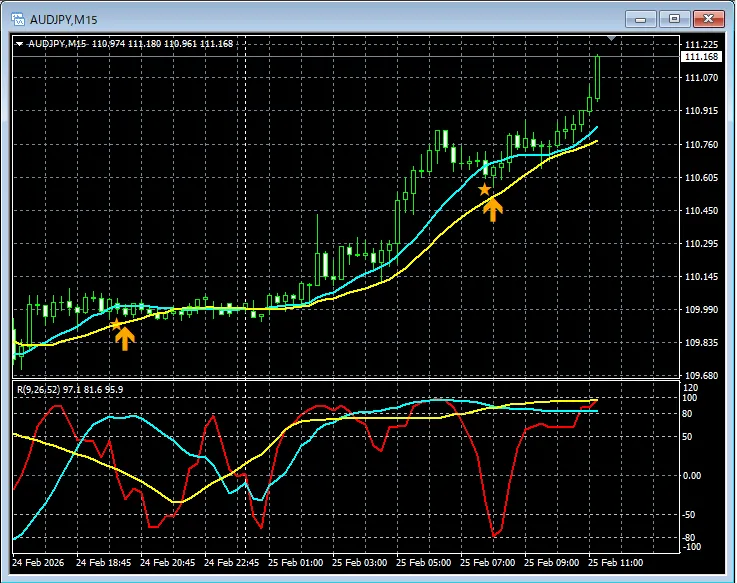
In the chart above,the mBDSR signallights up at the right timing.
In the case of the moving-average-filter mBDSRas well,when combined with the consolidation of higher timeframes to lower timeframes using three RCI lines, you can achieve high-probability trades. This is also explained in the accompanying PDF.※ Please note that on the charts shown in this article, for convenience of explanation, circles, straight lines, and rectangles may be drawn.Indicator that shines in combination with RCI: 【BODSOR・mBDSR】and Methods・Case Studies (PDF) ★GogoJungle AWARD2020 Winner★https://www.gogojungle.co.jp/tools/indicators/11836The package includes 550+ PDF files (Methods and Case Studies: total over 1,950 pages, over 690,000 characters).Most of these are examples that lay out a process of logically linking higher and lower timeframes by using the three RCI lines, sequentially examining multiple lower timeframes, and ultimately waiting for the dip-buying or pullback-selling signals on the lower timeframes (i.e., mBDSR signals).Additionally,there are many PDFs focusing on identifying points where multiple entry bases overlap.There are also PDFs that explore how to use the RCI three-line setup to anticipate gains or declines.In the PDF explanations,more than 1,900 charts are used.Blacksun Indicators (Overview)https://www.gogojungle.co.jp/finance/navi/articles/33779About Blacksun Free Indicators and Free E-bookshttps://www.gogojungle.co.jp/finance/navi/articles/90181【Reference Videos (RCI and mBDSR related)】Environment recognition with RCI and multi-time-frame analysis to bring it to the point of waiting for signals (Part 1)https://www.youtube.com/watch?v=1prvET_M5mAEnvironment recognition with RCI and multi-time-frame analysis to bring it to the point of waiting for signals (Part 2)https://www.youtube.com/watch?v=vR4oD-oMVQQEnvironment recognition with RCI and multi-time-frame analysis to bring it to the point of waiting for signals (Part 3)https://www.youtube.com/watch?v=C6DHn0lD-I4Environment recognition with RCI and multi-time-frame analysis to bring it to the point of waiting for signals (Part 4)https://www.youtube.com/watch?v=QG1iNTnLyyQEnvironment recognition with RCI and multi-time-frame analysis to bring it to the point of waiting for signals (Part 5)https://www.youtube.com/watch?v=VYlGiy6Cllg
※ Please note that on the charts shown in this article, for convenience of explanation, circles, straight lines, and rectangles may be drawn.
Indicator that shines in combination with RCI: 【BODSOR・mBDSR】
and Methods・Case Studies (PDF) ★GogoJungle AWARD2020 Winner★
https://www.gogojungle.co.jp/tools/indicators/11836
The package includes 550+ PDF files (Methods and Case Studies: total over 1,950 pages, over 690,000 characters).
Most of these are examples that lay out a process of logically linking higher and lower timeframes by using the three RCI lines, sequentially examining multiple lower timeframes, and ultimately waiting for the dip-buying or pullback-selling signals on the lower timeframes (i.e., mBDSR signals).
Additionally,there are many PDFs focusing on identifying points where multiple entry bases overlap.There are also PDFs that explore how to use the RCI three-line setup to anticipate gains or declines.
In the PDF explanations,
more than 1,900 charts are used.

Blacksun Indicators (Overview)
https://www.gogojungle.co.jp/finance/navi/articles/33779
About Blacksun Free Indicators and Free E-books
https://www.gogojungle.co.jp/finance/navi/articles/90181
【Reference Videos (RCI and mBDSR related)】
Environment recognition with RCI and multi-time-frame analysis to bring it to the point of waiting for signals (Part 1)
https://www.youtube.com/watch?v=1prvET_M5mA
Environment recognition with RCI and multi-time-frame analysis to bring it to the point of waiting for signals (Part 2)
https://www.youtube.com/watch?v=vR4oD-oMVQQ
Environment recognition with RCI and multi-time-frame analysis to bring it to the point of waiting for signals (Part 3)
https://www.youtube.com/watch?v=C6DHn0lD-I4
Environment recognition with RCI and multi-time-frame analysis to bring it to the point of waiting for signals (Part 4)
https://www.youtube.com/watch?v=QG1iNTnLyyQ
Environment recognition with RCI and multi-time-frame analysis to bring it to the point of waiting for signals (Part 5)
https://www.youtube.com/watch?v=VYlGiy6Cllg
× ![]()


