

【Master RCI to Victory!!】Dollar-Yen 5-minute chart mBDSR signal
【Mastering RCI!! Trend Reversals, Buy the Dip, Sell the Rally】
Indicator that shines in combination with RCI: 【BODSOR・mBDSR】
Methods, and Case Studies (PDF) ★GogoJungle AWARD2020 Winner★
https://www.gogojungle.co.jp/tools/indicators/11836
※This product【BODSOR・mBDSR】includes over 550 PDFs (totaling over 1,950 pages, over 1,900 charts, and over 690,000 characters) as methods and case studies.
About the PDFs included in the above product
【BODSOR・mBDSR】 358 attached PDF files
https://www.gogojungle.co.jp/finance/navi/articles/34271
【Mastering RCI!!】 Summary of PDFs explaining mBDSR (Moving Average Filter)
https://www.gogojungle.co.jp/finance/navi/articles/90127
【Mastering RCI!!】 PDF Collection for Trading using 5-minute chart signals (Day Trading)
https://www.gogojungle.co.jp/finance/navi/articles/89870
【Mastering RCI!!】 PDF collection for 1-minute short-term trading (Scalping)
https://www.gogojungle.co.jp/finance/navi/articles/88762
【Mastering RCI!!】 Summary of PDFs explaining profit-taking points
https://www.gogojungle.co.jp/finance/navi/articles/89471
PDF collection for effectively utilizing R1R2S2【Mastering RCI!!】
https://www.gogojungle.co.jp/finance/navi/articles/93154
【Mastering RCI!!】 PDF collection for effectively using MT5 version of mBDSR
https://www.gogojungle.co.jp/finance/navi/articles/84918
Below, we introduce examples of signalsusing mBDSR (RCI two-filter)signals.
USD/JPY 5-minute chart
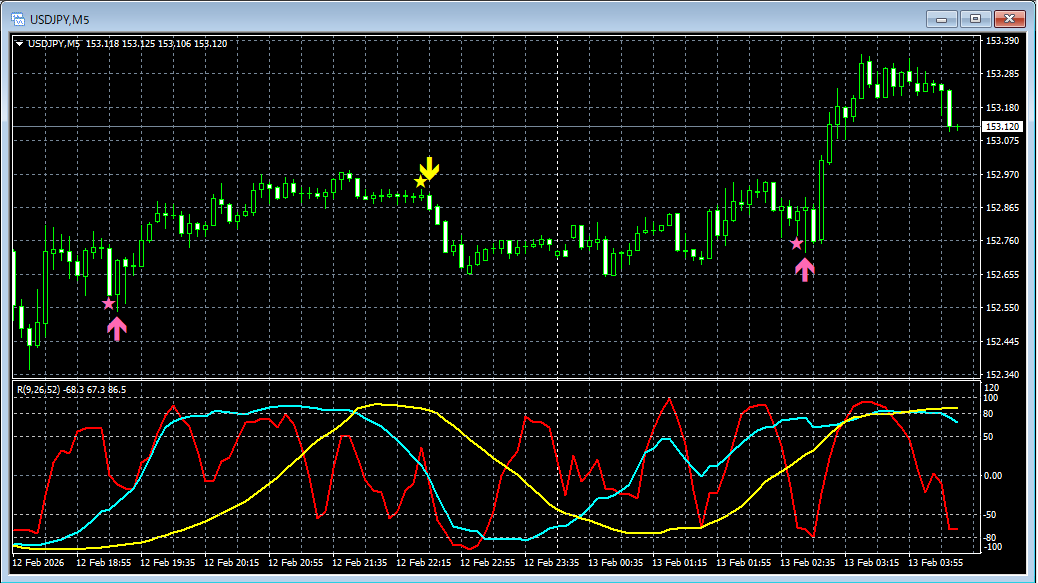
In the chart above,the signal of mBDSR (RCI two-filter)lights up at an opportune timing.
When using the Moving Average Filter mBDSRas well,combining with the RCI three-line trend to map from higher to lower timeframesenables high-probability trades. This is also explained in the attached PDF.
※Some charts mentioned in this article have been annotated with circles, lines, or rectangles for explanatory convenience. Thank you for understanding.
Indicator that shines in combination with RCI: 【BODSOR・mBDSR】
Methods and Case Studies (PDF) ★GogoJungle AWARD2020 Winner★
https://www.gogojungle.co.jp/tools/indicators/11836
Includes over 550 PDF files (Methods and Case Studies: totaling over 1,950 pages and over 690,000 characters).
Many of these areexamples of linking higher and lower timeframes logically with the three-line RCI, then systematically examining multiple lower-timeframe conditions and eventually waiting for dip-buying or pullback-selling timings (i.e., signals from mBDSR) on the lower timeframe..
Also,there are many that focus on capturing points where multiple entry reasons overlap..
Additionally,there are methods that explore ascending and descending targets using the three-line RCI..
In the PDF explanations,over 1,900 chartsare used.

Blacksun Indicators (List)
https://www.gogojungle.co.jp/finance/navi/articles/33779
Blacksun Free Indicators and Free eBooks
https://www.gogojungle.co.jp/finance/navi/articles/90181
【Reference Videos (RCI and mBDSR related)】
Environment recognition with RCI and multi-timeframe analysis leading to waiting for signals (1)
https://www.youtube.com/watch?v=1prvET_M5mA
Environment recognition with RCI and multi-timeframe analysis leading to waiting for signals (2)
https://www.youtube.com/watch?v=vR4oD-oMVQQ
Environment recognition with RCI and multi-timeframe analysis leading to waiting for signals (3)
https://www.youtube.com/watch?v=C6DHn0lD-I4
Environment recognition with RCI and multi-timeframe analysis leading to waiting for signals (4)
https://www.youtube.com/watch?v=QG1iNTnLyyQ
Environment recognition with RCI and multi-timeframe analysis leading to waiting for signals (5)
https://www.youtube.com/watch?v=VYlGiy6Cllg
× ![]()


