

To Master RCI and Win with a Moving Average Filter!! Today's USD/JPY 15-minute chart signals from mBDSR
【Mastering RCI!! Trend Reversal, Buy on Dips, Sell on Rallies】
Indicator that shows power when combined with RCI: 【BODSOR・mBDSR】
and methods, case studies (PDF) ★GogoJungle AWARD2020 Winner★
https://www.gogojungle.co.jp/tools/indicators/11836
※The product【BODSOR・mBDSR】includes over 550 PDFs as methods and case studies (total over 1,950 pages, over 1,900 chart images, over 690,000 words).
About the PDFs included with the above product
【BODSOR・mBDSR】 358 PDF files included
https://www.gogojungle.co.jp/finance/navi/articles/34271
【Mastering RCI and Winning!!】 Summary of PDFs explaining mBDSR (Moving Average Filter)
https://www.gogojungle.co.jp/finance/navi/articles/90127
【Mastering RCI and Winning!!】 PDF Collection for 5-minute chart signals used for day trading
https://www.gogojungle.co.jp/finance/navi/articles/89870
【Mastering RCI and Winning!!】 PDF collection for 1-minute chart short-term trading (scalping)
https://www.gogojungle.co.jp/finance/navi/articles/88762
【Mastering RCI and Winning!!】 Summary of PDFs explaining profit-taking points
https://www.gogojungle.co.jp/finance/navi/articles/89471
PDF collection for effectively utilizing R1R2S2【Mastering RCI and Winning!!】
https://www.gogojungle.co.jp/finance/navi/articles/93154
【Mastering RCI and Winning!!】 PDF collection for effectively using MT5 version mBDSR
https://www.gogojungle.co.jp/finance/navi/articles/84918
mBDSR (RCI Filter)andmBDSR (Moving Average Filter)have different roles. The accompanying PDFs also discuss how to use them properly.
Below, we 소개 examples of signals formBDSR (Moving Average Filter)signals.
USD/JPY 15-minute chart
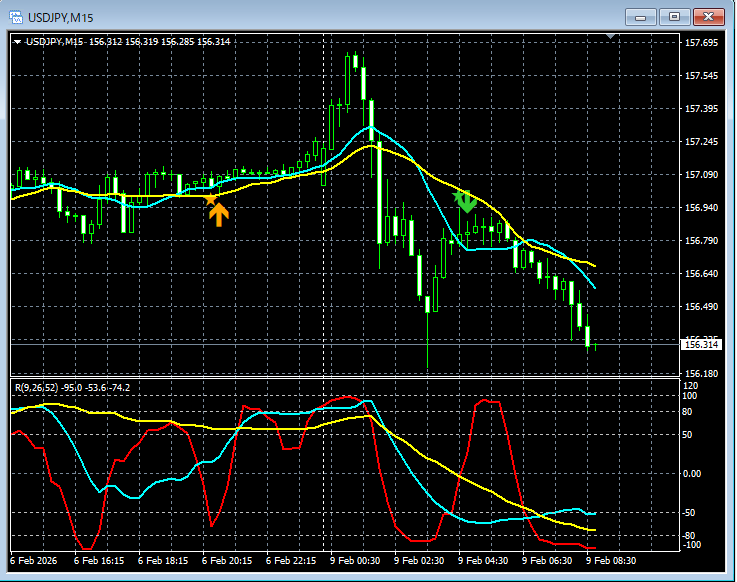
In the chart above,the mBDSR (Moving Average Filter) signallights up at the right timing.
In the case of the Moving Average Filter mBDSRas well,when used in conjunction with the higher-timeframe to lower-timeframe consolidation using the three RCI lines, it enables high-probability trades. Explanations for this area are alsoin the accompanying PDF.
※ Please note that charts shown in this article may include added circles, lines, or rectangles for explanatory convenience.
Indicator that shows power when combined with RCI【BODSOR・mBDSR】
and methods, case studies (PDF) ★GogoJungle AWARD2020 Winner★
https://www.gogojungle.co.jp/tools/indicators/11836
Includes over 550 PDF files (methods and case studies: total over 1,950 pages, over 690,000 words).
Most of them aredesigned to logically link higher and lower timeframes using the three RCI lines, examining the status of multiple lower timeframes sequentially, and ultimately waiting for dips or pullbacks signals on the lower timeframe (i.e., mBDSR signals)..
Also,many works focus on identifying points where multiple entry reasons overlap..
In addition,there are methods for exploring upside/downside targets using three-line RCI..
In the PDF explanations,over 1,900 chart images are used..
Blacksun Indicators (List)
https://www.gogojungle.co.jp/finance/navi/articles/33779
Free Blacksun indicators and free e-books
https://www.gogojungle.co.jp/finance/navi/articles/90181
【Reference videos (RCI and mBDSR related)】
Bringing signals through environment recognition and multi-time-frame analysis using RCI (1)
https://www.youtube.com/watch?v=1prvET_M5mA
Bringing signals through environment recognition and multi-time-frame analysis using RCI (2)
https://www.youtube.com/watch?v=vR4oD-oMVQQ
Bringing signals through environment recognition and multi-time-frame analysis using RCI (3)
https://www.youtube.com/watch?v=C6DHn0lD-I4
Bringing signals through environment recognition and multi-time-frame analysis using RCI (4)
https://www.youtube.com/watch?v=QG1iNTnLyyQ
Bringing signals through environment recognition and multi-time-frame analysis using RCI (5)
https://www.youtube.com/watch?v=VYlGiy6Cllg
× ![]()


