

Example of trend reversal seen from the sign of "RCI3 Three-Line+mBDSR" (GBP/USD 30-minute chart)
The figure below is a 30-minute chart of the Pound-Dollar.
Pound-Dollar 30-minute chart
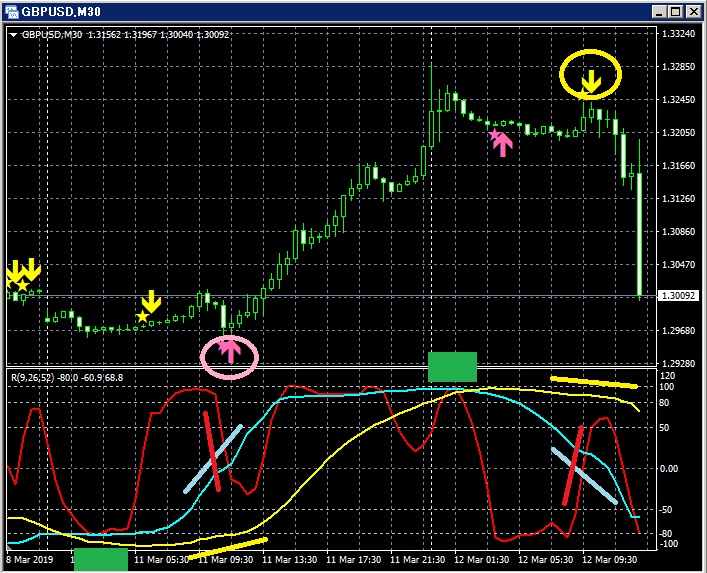
Upper section:mBDSR
Lower section: Three RCI lines (red: RCI9, light blue: RCI26, yellow: RCI52)
(1)
Falls close to a triple-bottom formed by RCI3. Afterward, RCI9 rises once.
When RCI9 turns downward again, RCI26 and RCI52 turn upward.
(2) Buy the dip signal
Among the three RCI lines, only RCI9 is clearly declining.
If RCI9 reverses to rise, all three RCI lines may rise together.
In other words, the price may also rise strongly.
In such a situation, the mBDSR buy-the-dip signal (pink arrow circled) lights up.
Immediately after the signal lights, nine consecutive bullish candles occur, indicating the price is rising smoothly.
(3)
Rises toward a shape close to a triple-top on RCI3. Then, RCI9 declines once.
When RCI9 turns upward again, RCI26 and RCI52 turn downward.
(4) Sell the rebound signal
Among the three RCI lines, only RCI9 is clearly rising.
If RCI9 reverses to decline, all three RCI lines may decline together.
In other words, the price may fall strongly.
In this situation, the mBDSR sell-the-rebound signal (yellow arrow circled) lights up.
Subsequently, the price continues to decline smoothly.
The sales page for BODSOR (mBDSR) ishere.


