

【Master RCI to Win!!】Recent Nikkei 225 JP225 5-minute MBDSR signal
【Mastering RCI!! Trend Reversal, Buy Dips, Sell Rallies】
Indicator【BODSOR・mBDSR】that exerts power in combination with RCI
and methods, case studies (PDF) ★GogoJungle AWARD 2020 winner★
https://www.gogojungle.co.jp/tools/indicators/11836
This product【BODSOR・mBDSR】includes over 550 PDFs (totaling over 1,950 pages, over 1,900 chart slides, over 690,000 characters) as methods and case studies.
Regarding the PDFs included in the above product
【BODSOR・mBDSR】 358 attached PDFs
https://www.gogojungle.co.jp/finance/navi/articles/34271
【Mastering RCI!!】 Summary of PDFs describing mBDSR (Moving Average Filter)
https://www.gogojungle.co.jp/finance/navi/articles/90127
【Mastering RCI!!】 Additional PDFs for trading using 5-minute chart signals (Day Trading)
https://www.gogojungle.co.jp/finance/navi/articles/89870
【Mastering RCI!!】 PDFs for short-term trading on 1-minute chart (Scalping)
https://www.gogojungle.co.jp/finance/navi/articles/88762
【Mastering RCI!!】 Summary of PDFs describing profit-taking points
https://www.gogojungle.co.jp/finance/navi/articles/89471
PDF collection to effectively use R1R2S2【Mastering RCI!!】
https://www.gogojungle.co.jp/finance/navi/articles/93154
【Mastering RCI!!】 PDF collection for effectively using MT5 version of mBDSR
https://www.gogojungle.co.jp/finance/navi/articles/84918
Nikkei Average JP225 5-minute chart
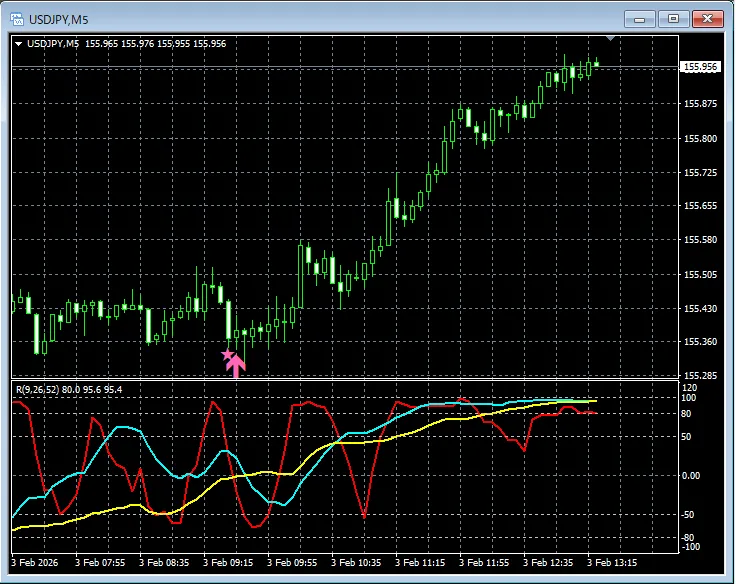
In the chart above,signals of mBDSR (RCI with 2 lines) are lighting up at the right timing..
※Please note that the charts introduced in this article may have annotations such as circles, lines, and rectangles added for convenience of explanation.
Indicator that shines in combination with RCI【BODSOR・mBDSR】
and methods, case studies (PDF) ★GogoJungle AWARD 2020 winner★
https://www.gogojungle.co.jp/tools/indicators/11836
Includes over 550 PDF files (methods and case studies: total over 1,950 pages, over 690,000 characters).
Many of these are about logically linking higher and lower timeframes using three RCI lines to examine multiple lower-timeframe situations sequentially, ultimately waiting for dips or pullbacks on the lower timeframe (the mBDSR signal).It is thus compiled.
Also,many focus on capturing points where multiple entry reasons converge.Therefore,
Additionally,there are methods to explore upside and downside targets using three-line RCI.Also included.
In the PDF explanations,over 1,900 charts are used.

Blacksun Indicators (List)
https://www.gogojungle.co.jp/finance/navi/articles/33779
About Blacksun Free Indicators and Free E-books
https://www.gogojungle.co.jp/finance/navi/articles/90181
【Reference Videos (RCI and mBDSR related)】
Environment recognition and multi-timeframe analysis using RCI to bring the signal waiting form (1)
https://www.youtube.com/watch?v=1prvET_M5mA
Environment recognition and multi-timeframe analysis using RCI to bring the signal waiting form (2)
https://www.youtube.com/watch?v=vR4oD-oMVQQ
Environment recognition and multi-timeframe analysis using RCI to bring the signal waiting form (3)
https://www.youtube.com/watch?v=C6DHn0lD-I4
Environment recognition and multi-timeframe analysis using RCI to bring the signal waiting form (4)
https://www.youtube.com/watch?v=QG1iNTnLyyQ
Environment recognition and multi-timeframe analysis using RCI to bring the signal waiting form (5)
https://www.youtube.com/watch?v=VYlGiy6Cllg
× ![]()


