

[Master RCI and Move to Win with Moving Average Filter!!] USD/JPY USDJPY 1-hour chart mBDSR signal
【Master RCI!! Trend Reversal・Pullback Buying・Pullback Selling】
Indicator that shines when used with RCI: 【BODSOR・mBDSR】
Methods・Case Studies (PDF) ★GogoJungle AWARD 2020 Winner★
https://www.gogojungle.co.jp/tools/indicators/11836
※This product【BODSOR・mBDSR】includes 550+ PDFs (Total 1,950+ pages, 1,900+ chart images, over 690,000 characters) as methods and case studies.
About the PDFs included with the above product
About the 358 PDFs included with 【BODSOR・mBDSR】
https://www.gogojungle.co.jp/finance/navi/articles/34271
Summary of PDFs that explain about mBDSR (moving average filter) in 【Master RCI!!】
https://www.gogojungle.co.jp/finance/navi/articles/90127
【Master RCI!!】PDF Additions: Collection of PDFs for trading using 5-minute candle signals (day trading)
https://www.gogojungle.co.jp/finance/navi/articles/89870
【Master RCI!!】PDF collection for short-term trading with 1-minute chart (scalping)
https://www.gogojungle.co.jp/finance/navi/articles/88762
【Master RCI!!】Summary of PDFs explaining profit-taking points
https://www.gogojungle.co.jp/finance/navi/articles/89471
PDF collection for effectively utilizing R1R2S2【Master RCI!!】
https://www.gogojungle.co.jp/finance/navi/articles/93154
【Master RCI!!】PDF collection for effectively using MT5 version of mBDSR
https://www.gogojungle.co.jp/finance/navi/articles/84918
mBDSR (RCI Filter)andmBDSR (Moving Average Filter)have different roles. The accompanying PDFs also discuss how to use them distinctly.
Below, we introduce examples of signals formBDSR (Moving Average Filter)signals.
USD/JPY 1-hour chart
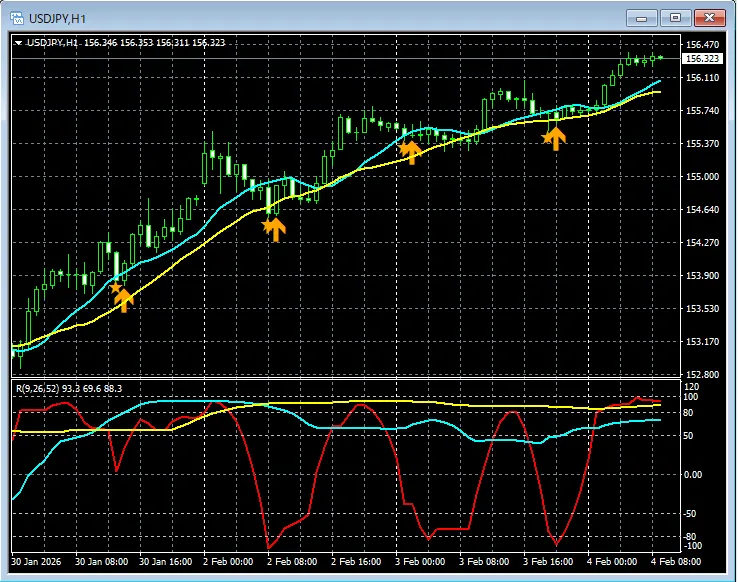
On the chart above,the mBDSR signallights up at the right timing.
In the case ofthe Moving Average Filter mBDSRwhen combined with the use of RCI’s three-line top-down signalsallows for high-probability trades. The accompanying PDFs explain more about this.
※ In the charts shown in this article, circles, straight lines, and boxes may be drawn for convenience of explanation, please note.
Indicator that shines when used with RCI【BODSOR・mBDSR】
Methods・Case Studies (PDF) ★GogoJungle AWARD 2020 Winner★
https://www.gogojungle.co.jp/tools/indicators/11836
550+ PDFs (Methods・Case Studies: Total 1,950+ pages, over 690,000 characters) are included.
Many of them areexamples that logically link higher and lower timeframes using the three RCI lines, then progressively analyze multiple lower-timeframe conditions, ultimately waiting for pullbacks buys or pullback sells on the lower timeframe as signals from mBDSR.
Also,there are many that focus on capturing points where multiple entry criteria overlap..
Additionally,there are methods that explore rise and fall targets using the three-line RCI..
In the PDF explanations,over 1,900 charts are used..

Blacksun Indicators (List)
https://www.gogojungle.co.jp/finance/navi/articles/33779
Blacksun Free Indicators and Free eBooks
https://www.gogojungle.co.jp/finance/navi/articles/90181
【Reference Videos (RCI and mBDSR related)】
Environment recognition with RCI and multi-timeframe analysis leading to waiting for signals (1)
https://www.youtube.com/watch?v=1prvET_M5mA
Environment recognition with RCI and multi-timeframe analysis waiting for signals (2)
https://www.youtube.com/watch?v=vR4oD-oMVQQ
Environment recognition with RCI and multi-timeframe analysis waiting for signals (3)
https://www.youtube.com/watch?v=C6DHn0lD-I4
Environment recognition with RCI and multi-timeframe analysis waiting for signals (4)
https://www.youtube.com/watch?v=QG1iNTnLyyQ
Environment recognition with RCI and multi-timeframe analysis waiting for signals (5)
https://www.youtube.com/watch?v=VYlGiy6Cllg
× ![]()


