

Crush RCI to the limit!! 】mBDSR's RCI filter and moving average filter (7) USD/CHF 15-minute chart
【Master RCI!! Trend Reversal, Buy on Pullback, Sell on Rallies】
Indicator that shines in combination with RCI: 【BODSOR・mBDSR】
and methods, case studies (PDF) ★GogoJungle AWARD2020 winner★
https://www.gogojungle.co.jp/tools/indicators/11836
※This product 【BODSOR・mBDSR】 includes more than 550 PDFs (total over 1,950 pages, over 1,900 chart sheets, over 690,000 words) as methods and case studies.
About the PDFs included in the above product
【BODSOR・mBDSR】 358 included PDF files
https://www.gogojungle.co.jp/finance/navi/articles/34271
Summary of PDFs explaining mBDSR (Movement Average Filter) explained in【RCI Mastery and Profit!!】
https://www.gogojungle.co.jp/finance/navi/articles/90127
【RCI Mastery and Profit!!】 PDF additions for trader using 5-minute chart signals
https://www.gogojungle.co.jp/finance/navi/articles/89870
【RCI Mastery and Profit!!】 PDF collection for 1-minute short-term trading (scalping)
https://www.gogojungle.co.jp/finance/navi/articles/88762
【RCI Mastery and Profit!!】 Summary of PDFs explaining profit-taking points
https://www.gogojungle.co.jp/finance/navi/articles/89471
PDF collection for effectively using R1R2S2【RCI Mastery and Profit!!】
https://www.gogojungle.co.jp/finance/navi/articles/93154
【RCI Mastery and Profit!!】 PDF collection for effectively utilizing MT5 version of mBDSR
https://www.gogojungle.co.jp/finance/navi/articles/84918
mBDSR (RCI Filter)andmBDSR (Moving Average Filter)serve different roles. The usage distinctions are also covered in the included PDFs.
Below,mBDSR (RCI Filter)andmBDSR (Moving Average Filter)their signals on charts showing both will be introduced.
USD/CHF 15-minute chart
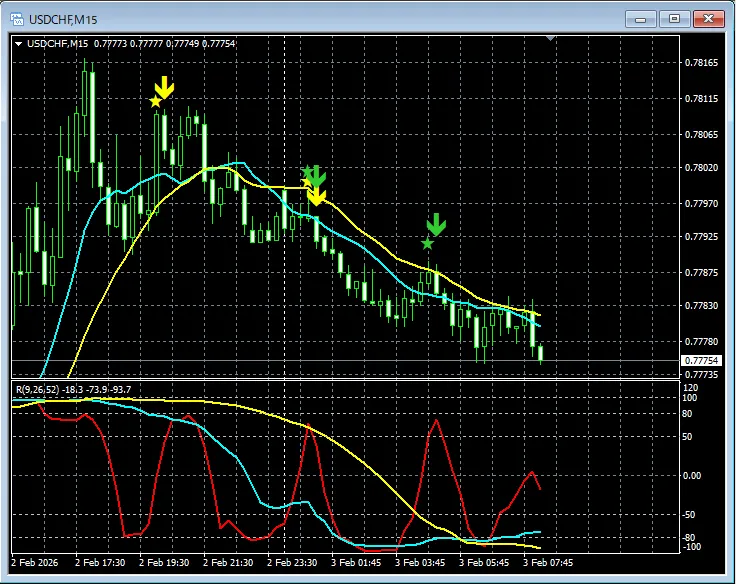
In the above chart,signals from mBDSR (RCI two-filter and moving average filter)signal at timely points.
For the Moving Average Filter mBDSRas well,by integrating with higher-to-lower time-frame down-sampling using the RCI three-line, you can achieve higher-probability trades. The included PDFs explain this.※ Please note that in the charts shown in this article, for clarity, circles, lines and rectangles may be drawn.Indicator that shines in combination with RCI【BODSOR・mBDSR】and methods, case studies (PDF) ★GogoJungle AWARD2020 winner★https://www.gogojungle.co.jp/tools/indicators/11836Over 550 PDF files (methods and case studies: total over 1,950 pages, over 690,000 words) are included.Many of them areexamples that logically link higher and lower time frames using the three-line RCI to examine the status of multiple lower-time-frame charts successively, ultimately waiting for pullbacks or pullbacks timing signals from mBDSR on the lower time frame.Also,many focus on capturing points where multiple entry reasons overlap..Additionally,there are methods that explore upside and downside targets using the RCI three-line strategy..In the PDF explanations,over 1,900 charts are used..Blacksun Indicators (List)https://www.gogojungle.co.jp/finance/navi/articles/33779Free Blacksun indicators and free e-bookshttps://www.gogojungle.co.jp/finance/navi/articles/90181【Reference Videos (RCI and mBDSR related)】Environment recognition with RCI and multi-time-frame analysis leading to waiting for a signal (1)https://www.youtube.com/watch?v=1prvET_M5mAEnvironment recognition with RCI and multi-time-frame analysis leading to waiting for a signal (2)https://www.youtube.com/watch?v=vR4oD-oMVQQEnvironment recognition with RCI and multi-time-frame analysis leading to waiting for a signal (3)https://www.youtube.com/watch?v=C6DHn0lD-I4Environment recognition with RCI and multi-time-frame analysis leading to waiting for a signal (4)https://www.youtube.com/watch?v=QG1iNTnLyyQEnvironment recognition with RCI and multi-time-frame analysis leading to waiting for a signal (5)https://www.youtube.com/watch?v=VYlGiy6Cllg
※ Please note that in the charts shown in this article, for clarity, circles, lines and rectangles may be drawn.
Indicator that shines in combination with RCI【BODSOR・mBDSR】
and methods, case studies (PDF) ★GogoJungle AWARD2020 winner★
https://www.gogojungle.co.jp/tools/indicators/11836
Over 550 PDF files (methods and case studies: total over 1,950 pages, over 690,000 words) are included.
Many of them areexamples that logically link higher and lower time frames using the three-line RCI to examine the status of multiple lower-time-frame charts successively, ultimately waiting for pullbacks or pullbacks timing signals from mBDSR on the lower time frame.
Also,many focus on capturing points where multiple entry reasons overlap..
Additionally,there are methods that explore upside and downside targets using the RCI three-line strategy..
In the PDF explanations,over 1,900 charts are used..
Blacksun Indicators (List)
https://www.gogojungle.co.jp/finance/navi/articles/33779
Free Blacksun indicators and free e-books
https://www.gogojungle.co.jp/finance/navi/articles/90181
【Reference Videos (RCI and mBDSR related)】
Environment recognition with RCI and multi-time-frame analysis leading to waiting for a signal (1)
https://www.youtube.com/watch?v=1prvET_M5mA
Environment recognition with RCI and multi-time-frame analysis leading to waiting for a signal (2)
https://www.youtube.com/watch?v=vR4oD-oMVQQ
Environment recognition with RCI and multi-time-frame analysis leading to waiting for a signal (3)
https://www.youtube.com/watch?v=C6DHn0lD-I4
Environment recognition with RCI and multi-time-frame analysis leading to waiting for a signal (4)
https://www.youtube.com/watch?v=QG1iNTnLyyQ
Environment recognition with RCI and multi-time-frame analysis leading to waiting for a signal (5)
https://www.youtube.com/watch?v=VYlGiy6Cllg
× ![]()


