

【RCI3 main line+mBDSR】15-minute chart → 5-minute chart → 1-minute chart, 순서대로戻り売りサイン点灯(AUDJPY)
※BODSOR and mBDSR are indicators developed to improve entry precision when buying on dips or selling on rallies using three-line RCI.
These are indicators designed to enhance entry accuracy for dip buying and rally selling using three-line RCI.
The sales page for BODSOR (mBDSR) ishere.
The figure below is the AUDJPY on the 15-minute, 5-minute, and 1-minute charts.
AUDJPY 15-minute chart
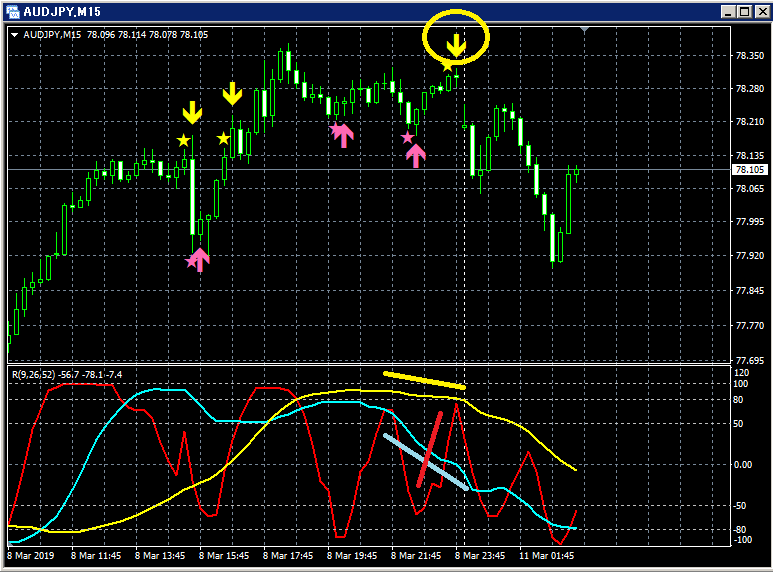
Top row:mBDSR
Bottom row: Three-line RCI (red: RCI9, light blue: RCI26, yellow: RCI52)
AUDJPY 5-minute chart
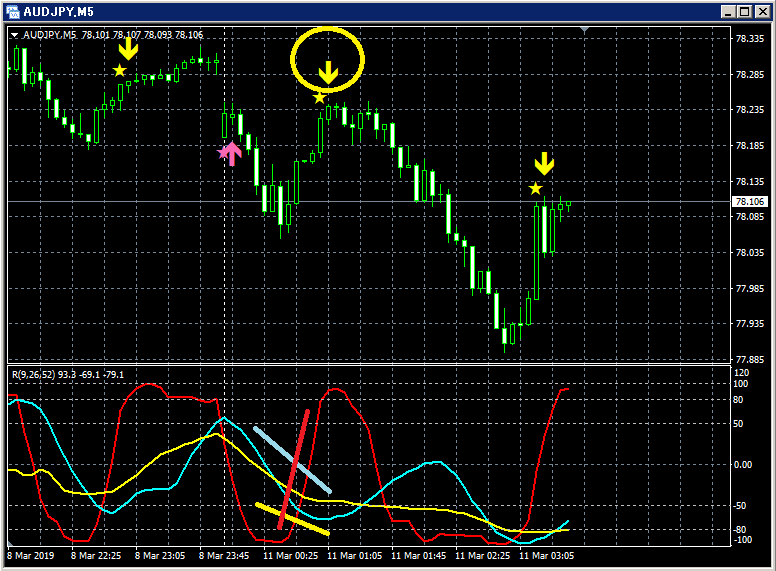
Top row:mBDSR
Bottom row: Three-line RCI (red: RCI9, light blue: RCI26, yellow: RCI52)
AUDJPY 1-minute chart
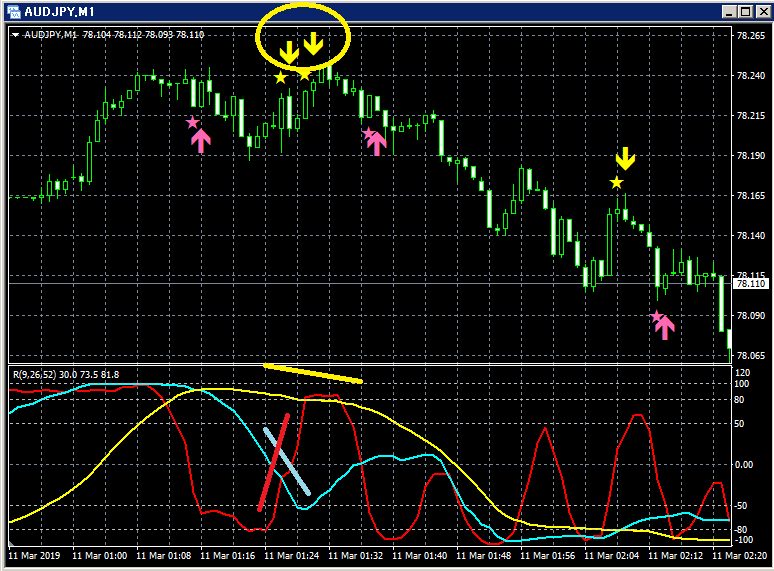
Top row:mBDSR
Bottom row: Three-line RCI (red: RCI9, light blue: RCI26, yellow: RCI52)
Among the three RCI lines, only RCI9 is clearly rising.
If RCI9 turns downward, all three RCI lines may turn downward.
In other words, prices may experience a strong decline.
In such a scenario, on the 15-minute, 5-minute, or 1-minute chart, the mBDSR sell-rebound signal (yellow arrow encircled) lights up
and the price subsequently moves downward.
The sales page for BODSOR (mBDSR) ishere.

× ![]()


