

[Master RCI to the Extreme!!] Today's AUDUSD 30-minute chart mBDSR signal
【Master RCI!! Trend Reversal, Pullback Buying, and Pullback Selling】
Indicator that shines in combination with RCI: 【BODSOR・mBDSR】
and methods, case studies (PDF) ★GogoJungle AWARD2020 Winner★
https://www.gogojungle.co.jp/tools/indicators/11836
This product【BODSOR・mBDSR】includes over 550 PDF files (totaling over 1,950 pages, over 1,900 chart images, over 690,000 characters) as methods and case studies.
About the PDFs included with the above product
For the 358 PDF files included with【BODSOR・mBDSR】
https://www.gogojungle.co.jp/finance/navi/articles/34271
【Master RCI to Win!!】Summary of PDFs with explanations for mBDSR (Moving Average Filter)
https://www.gogojungle.co.jp/finance/navi/articles/90127
【Master RCI to Win!!】Added PDF Collection for Trading Using 5-Minute Signals (Day Trading)
https://www.gogojungle.co.jp/finance/navi/articles/89870
【Master RCI to Win!!】PDF Collection for Short-Term 1-Minute Scalping
https://www.gogojungle.co.jp/finance/navi/articles/88762
【Master RCI to Win!!】Summary of PDFs Explaining Profit-Taking Points
https://www.gogojungle.co.jp/finance/navi/articles/89471
PDF Collection for Effectively Using R1R2S2【Master RCI to Win!!】
https://www.gogojungle.co.jp/finance/navi/articles/93154
【Master RCI to Win!!】PDF Collection for Effectively Using MT5 Version of mBDSR
https://www.gogojungle.co.jp/finance/navi/articles/84918
AUD/USD 30-Minute Chart
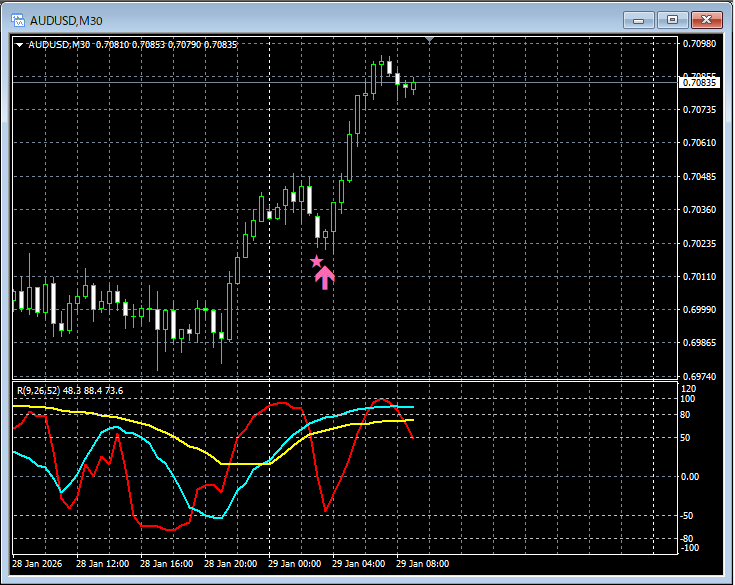
mBDSR (RCI Two-Filter)Signals
In the above chart,the signals of mBDSR (Two RCI Filters) are lighting up at the right timingas can be seen.
Indicator that shines in combination with RCI【BODSOR・mBDSR】
and methods, case studies (PDF) ★GogoJungle AWARD2020 Winner★
https://www.gogojungle.co.jp/tools/indicators/11836
Includes over 550 PDF files (methods and case studies: over 1,950 pages, over 690,000 characters).
Most of them arecollections showing how to logically link higher and lower timeframes using the three-line RCI, examining multiple lower-timeframe conditions sequentially, and ultimately waiting for pullback buying or pullback selling timing (i.e., mBDSR signals) on the lower timeframes.
Also,there are many that emphasize capturing points where multiple entry reasons overlap.
Additionally,there are methods that explore upside and downside targets using three-line RCI.
In the PDF explanations,more than 1,900 chartsare used.

Blacksun’s Indicators (List)
https://www.gogojungle.co.jp/finance/navi/articles/33779
About Blacksun free indicators and free e-books
https://www.gogojungle.co.jp/finance/navi/articles/90181
【Reference Videos (RCI and mBDSR Related)】
Environment recognition with RCI and multi-timeframe analysis to bring you to the point of waiting for a signal (1)
https://www.youtube.com/watch?v=1prvET_M5mA
Environment recognition with RCI and multi-timeframe analysis to bring you to the point of waiting for a signal (2)
https://www.youtube.com/watch?v=vR4oD-oMVQQ
Environment recognition with RCI and multi-timeframe analysis to bring you to the point of waiting for a signal (3)
https://www.youtube.com/watch?v=C6DHn0lD-I4
Environment recognition with RCI and multi-timeframe analysis to bring you to the point of waiting for a signal (4)
https://www.youtube.com/watch?v=QG1iNTnLyyQ
Environment recognition with RCI and multi-timeframe analysis to bring you to the point of waiting for a signal (5)
https://www.youtube.com/watch?v=VYlGiy6Cllg
× ![]()


