

[Master RCI and win with a moving average filter!!] Latest AUDJPY 30-minute chart mBDSR signal
【Mastering RCI!! Trend Reversals, Buy Dips, and Sell Rallies】
Indicator that shines when combined with RCI: 【BODSOR・mBDSR】
methods and case studies (PDF) ★GogoJungle AWARD2020 winner★
https://www.gogojungle.co.jp/tools/indicators/11836
※This product【BODSOR・mBDSR】includes over 550 PDFs (totaling over 1,950 pages, over 1,900 chart images, and over 690,000 characters) as part of the methods and case studies.
About the PDFs included with the above product
About the 358 PDF files included with 【BODSOR・mBDSR】
https://www.gogojungle.co.jp/finance/navi/articles/34271
Summary of PDFs explaining the mBDSR (Moving Average Filter) in 【Mastering RCI!!】
https://www.gogojungle.co.jp/finance/navi/articles/90127
【Mastering RCI!!】 PDF Collection for trades using 5-minute signals (Day Trading)
https://www.gogojungle.co.jp/finance/navi/articles/89870
【Mastering RCI!!】 PDF collection for short-term 1-minute trades (Scalping)
https://www.gogojungle.co.jp/finance/navi/articles/88762
【Mastering RCI!!】 Summary of PDFs describing profit-taking points
https://www.gogojungle.co.jp/finance/navi/articles/89471
PDF collection for effectively utilizing R1R2S2【Mastering RCI!!】
https://www.gogojungle.co.jp/finance/navi/articles/93154
【Mastering RCI!!】 PDF collection for effectively utilizing the MT5 version of mBDSR
https://www.gogojungle.co.jp/finance/navi/articles/84918
mBDSR (RCI Filter)andmBDSR (Moving Average Filter)have different roles. The accompanying PDFs also discuss how to use them in combination.
Below, we introduce examples of signals formBDSR (Moving Average Filter)signals.
AUDJPY 30-minute chart
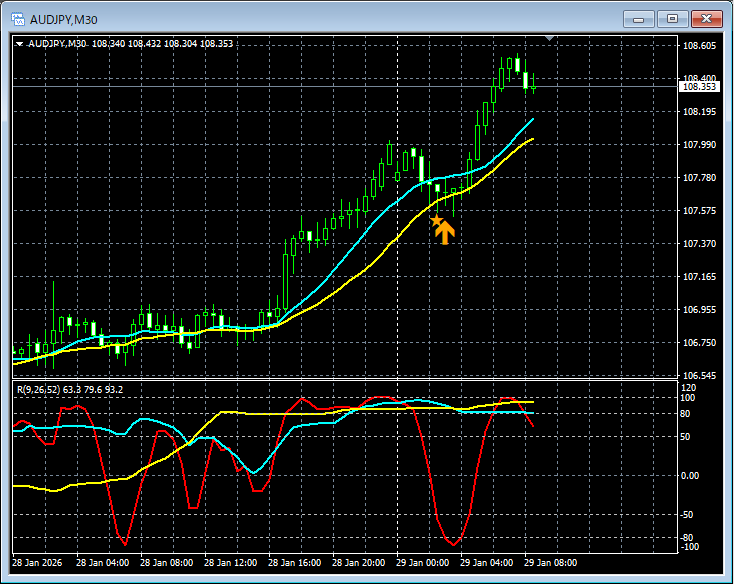
On the chart above,the signal from mBDSR (Moving Average Filter)lights up at the right timing.
In the case of the Moving Average Filter mBDSRas wellwhen combined with the high-to-low timeframe consolidation using the 3-line RCIit enables high-probability trades. This area is alsoexplained in the accompanying PDF.
※ Please note that on charts shown in this article, for convenience of explanation, circles, straight lines, squares, etc. may be drawn.
Indicators that shine when combined with RCI: 【BODSOR・mBDSR】
methods and case studies (PDF) ★GogoJungle AWARD2020 winner★
https://www.gogojungle.co.jp/tools/indicators/11836
Includes over 550 PDF files (methods and case studies: over 1,950 pages, over 690,000 characters).
Most of these are arranged to logically link higher and lower timeframes using the 3-line RCI, sequentially considering the status of multiple lower timeframes, and ultimately waiting for a dip-buy or a pullback-sell timing (i.e., the mBDSR signals) on the lower timeframes.
In addition,there are many that emphasize catching points where multiple entry reasons overlap..
Also included is a method to explore upside and downside targets using the three-line RCI.
In the PDF explanations,over 1,900 chartsare used.

Blacksun Indicators (List)
https://www.gogojungle.co.jp/finance/navi/articles/33779
Free Blacksun indicators and free eBooks
https://www.gogojungle.co.jp/finance/navi/articles/90181
【Reference videos (RCI and mBDSR related)】
Signaling approach with RCI: environmental awareness and multi-timeframe analysis (part 1)
https://www.youtube.com/watch?v=1prvET_M5mA
Signaling approach with RCI: environmental awareness and multi-timeframe analysis (part 2)
https://www.youtube.com/watch?v=vR4oD-oMVQQ
Signaling approach with RCI: environmental awareness and multi-timeframe analysis (part 3)
https://www.youtube.com/watch?v=C6DHn0lD-I4
Signaling approach with RCI: environmental awareness and multi-timeframe analysis (part 4)
https://www.youtube.com/watch?v=QG1iNTnLyyQ
Signaling approach with RCI: environmental awareness and multi-timeframe analysis (part 5)
https://www.youtube.com/watch?v=VYlGiy6Cllg
× ![]()


