

【Master RCI to Win with a Very Moving Average Filter!!】Dollar/Swiss USDCHF 15-minute chart mBDSR signal
【Mastering RCI!! Trend Reversals, Buy Dips, Sell Rallies】
Indicator that shines in combination with RCI: 【BODSOR・mBDSR】
and its method & case studies (PDF) ★GogoJungle AWARD2020 Winner★
https://www.gogojungle.co.jp/tools/indicators/11836
※This product【BODSOR・mBDSR】includes over 550 PDFs (totaling over 1,950 pages, over 1,900 chart images, and over 690,000 words) as its method and case studies.
About the PDFs included with the above product
【BODSOR・mBDSR】 358 PDFs included
https://www.gogojungle.co.jp/finance/navi/articles/34271
Summary of PDFs containing explanations about mBDSR (Movement Average Filter) in the article “Mastering RCI!!”
https://www.gogojungle.co.jp/finance/navi/articles/90127
【Mastering RCI!!】Additional PDFs: Trade using 5-minute chart signals (day trading) collection
https://www.gogojungle.co.jp/finance/navi/articles/89870
【Mastering RCI!!】PDF collection for 1-minute short-term trading (scalping)
https://www.gogojungle.co.jp/finance/navi/articles/88762
【Mastering RCI!!】Summary of PDFs explaining profit-taking points
https://www.gogojungle.co.jp/finance/navi/articles/89471
PDF collection for effectively using R1R2S2【Mastering RCI!!】
https://www.gogojungle.co.jp/finance/navi/articles/93154
【Mastering RCI!!】PDF collection for effectively using MT5 version of mBDSR
https://www.gogojungle.co.jp/finance/navi/articles/84918
mBDSR (RCI Filter)andmBDSR (Moving Average Filter)serve different roles. The accompanying PDFs also discuss how to use them appropriately.
Below, we introduce examples of signals formBDSR (Moving Average Filter)signals.
USDCHF – US Dollar/Swiss Franc 15-minute chart
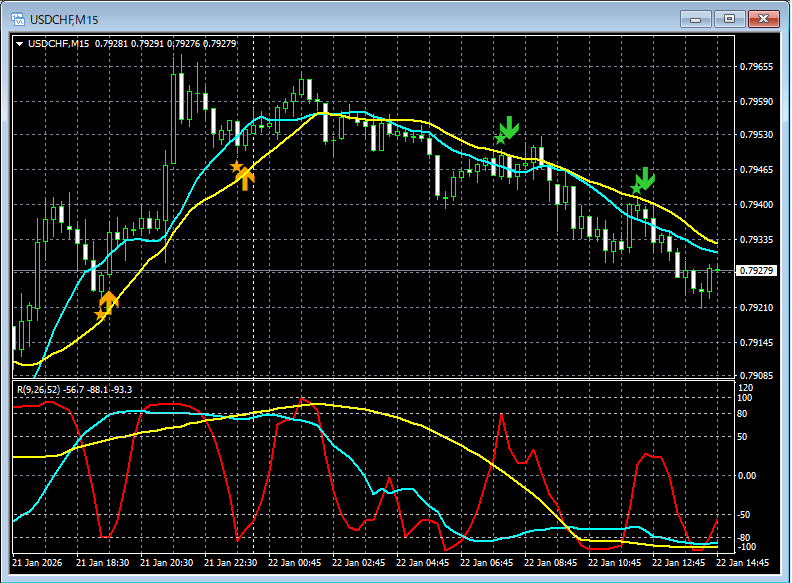
In the chart above,the mBDSR (Moving Average Filter) signallights up at the right timing.
In the case of the Moving Average Filter mBDSR,when combined withthe downward-to-upward view using the three RCI lines on a higher timeframeit enables high-probability trades. This is also explained in the attached PDFs.
※Please note that for convenience in this article, charts may include added circles, straight lines, or rectangles.
Indicator that shines in combination with RCI【BODSOR・mBDSR】
and its method & case studies (PDF) ★GogoJungle AWARD2020 Winner★
https://www.gogojungle.co.jp/tools/indicators/11836
Includes over 550 PDF files (method & case studies: totaling over 1,950 pages, over 690,000 words).
Most of them are about logically linking higher and lower timeframes using the three RCI lines, examining multiple lower-timeframe conditions sequentially, and ultimately waiting for dip-buy or pullback-sell timings (i.e., the signals of mBDSR) on the lower timeframes.
Additionally,many are focused on capturing points where multiple entry reasons overlap.There are also materials exploring how to analyze up-move and down-move targets using the RCI three-line setup.
In the PDFs,
over 1,900 chartsare used.

Blacksun's Indicators (List)
https://www.gogojungle.co.jp/finance/navi/articles/33779
About Blacksun's free indicators and free e-books
https://www.gogojungle.co.jp/finance/navi/articles/90181
【Reference videos (RCI and mBDSR related)】
Environment awareness using RCI and multi-timeframe analysis to wait for signals (Part 1)
https://www.youtube.com/watch?v=1prvET_M5mA
Environment awareness using RCI and multi-timeframe analysis to wait for signals (Part 2)
https://www.youtube.com/watch?v=vR4oD-oMVQQ
Environment awareness using RCI and multi-timeframe analysis to wait for signals (Part 3)
https://www.youtube.com/watch?v=C6DHn0lD-I4
Environment awareness using RCI and multi-timeframe analysis to wait for signals (Part 4)
https://www.youtube.com/watch?v=QG1iNTnLyyQ
Environment awareness using RCI and multi-timeframe analysis to wait for signals (Part 5)
https://www.youtube.com/watch?v=VYlGiy6Cllg
× ![]()


