

【Master RCI to win with Moving Average Filter!!】AUDJPY 5-minute chart mBDSR signal
【Mastering RCI!! Trend Reversal, Buy on Dips, Sell on Rises】
Indicator that shines in combination with RCI: 【BODSOR・mBDSR】
Methods, and Case Studies (PDF) ★GogoJungle AWARD2020 Winner★
https://www.gogojungle.co.jp/tools/indicators/11836
※This product【BODSOR・mBDSR】includes over 550 PDFs (totaling over 1,950 pages, over 1,900 chart images, and over 690,000 words) as methods and case studies.
Regarding the PDFs included with the above product
358 PDFs Included for【BODSOR・mBDSR】
https://www.gogojungle.co.jp/finance/navi/articles/34271
【Mastering RCI!!】 Summary of PDFs describing mBDSR (Moving Average Filter)
https://www.gogojungle.co.jp/finance/navi/articles/90127
【Mastering RCI!!】 New PDFs for Trading Using 5-minute Signals (Day Trading)
https://www.gogojungle.co.jp/finance/navi/articles/89870
【Mastering RCI!!】 1-minute Short-term Trading (Scalping) PDFs
https://www.gogojungle.co.jp/finance/navi/articles/88762
【Mastering RCI!!】 Summary of PDFs Explaining Profit-Taking Points
https://www.gogojungle.co.jp/finance/navi/articles/89471
PDF Collection to Effectively Utilize R1R2S2【Mastering RCI!!】
https://www.gogojungle.co.jp/finance/navi/articles/93154
【Mastering RCI!!】 PDF collection for effectively using MT5 version of mBDSR
https://www.gogojungle.co.jp/finance/navi/articles/84918
mBDSR (RCI Filter)andmBDSR (Moving Average Filter)have different roles. The included PDFs also touch on how to differentiate their use.
Below, we introduce examples of signals frommBDSR (Moving Average Filter)signals.
AUDJPY – Australian Dollar/Japanese Yen – 5-minute chart
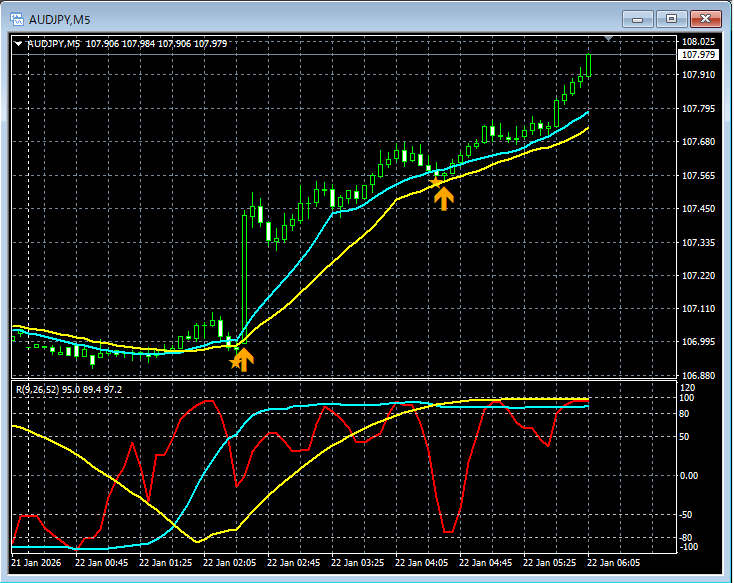
In the chart above,the mBDSR signallights up at the right timing.
With the Moving Average Filter mBDSRas wellWhen used in conjunction with the RCI 3-line over a higher timeframe leading to a lower timeframe, it enables high-probability trades. The PDFs included explain more about this.※ The charts shown in this article may have added circles, lines, or rectangles for explanatory convenience, please note.Indicator that shines in combination with RCI: 【BODSOR・mBDSR】Methods, and Case Studies (PDF) ★GogoJungle AWARD2020 Winner★https://www.gogojungle.co.jp/tools/indicators/11836Includes over 550 PDFs (methods and case studies: over 1,950 pages, over 690,000 words).Many of these are built around logically linking higher and lower timeframes using the 3-line RCI, examining multiple lower timeframes sequentially, and ultimately waiting for dip-buy or pullback sell signals on the lower timeframe (i.e., mBDSR signals).Additionally,these emphasize identifying points where multiple entry reasons align.Many entries focus on such overlap.Also included is a method for exploring upside and downside targets using the RCI 3-line combination.In the PDF explanations,over 1,900 chartsare used.Blacksun Indicators (List)https://www.gogojungle.co.jp/finance/navi/articles/33779Blacksun Free Indicators and Free E-bookshttps://www.gogojungle.co.jp/finance/navi/articles/90181【Reference Videos (RCI and mBDSR related)】Environment recognition with RCI and multi-timeframe analysis leading to a waiting-for-signal stance (Part 1)https://www.youtube.com/watch?v=1prvET_M5mAEnvironment recognition with RCI and multi-timeframe analysis leading to a waiting-for-signal stance (Part 2)https://www.youtube.com/watch?v=vR4oD-oMVQQEnvironment recognition with RCI and multi-timeframe analysis leading to a waiting-for-signal stance (Part 3)https://www.youtube.com/watch?v=C6DHn0lD-I4Environment recognition with RCI and multi-timeframe analysis leading to a waiting-for-signal stance (Part 4)https://www.youtube.com/watch?v=QG1iNTnLyyQEnvironment recognition with RCI and multi-timeframe analysis leading to a waiting-for-signal stance (Part 5)https://www.youtube.com/watch?v=VYlGiy6Cllg
※ The charts shown in this article may have added circles, lines, or rectangles for explanatory convenience, please note.
Indicator that shines in combination with RCI: 【BODSOR・mBDSR】
Methods, and Case Studies (PDF) ★GogoJungle AWARD2020 Winner★
https://www.gogojungle.co.jp/tools/indicators/11836
Includes over 550 PDFs (methods and case studies: over 1,950 pages, over 690,000 words).
Many of these are built around logically linking higher and lower timeframes using the 3-line RCI, examining multiple lower timeframes sequentially, and ultimately waiting for dip-buy or pullback sell signals on the lower timeframe (i.e., mBDSR signals).Additionally,
these emphasize identifying points where multiple entry reasons align.Many entries focus on such overlap.
Also included is a method for exploring upside and downside targets using the RCI 3-line combination.
In the PDF explanations,over 1,900 chartsare used.

Blacksun Indicators (List)
https://www.gogojungle.co.jp/finance/navi/articles/33779
Blacksun Free Indicators and Free E-books
https://www.gogojungle.co.jp/finance/navi/articles/90181
【Reference Videos (RCI and mBDSR related)】
Environment recognition with RCI and multi-timeframe analysis leading to a waiting-for-signal stance (Part 1)
https://www.youtube.com/watch?v=1prvET_M5mA
Environment recognition with RCI and multi-timeframe analysis leading to a waiting-for-signal stance (Part 2)
https://www.youtube.com/watch?v=vR4oD-oMVQQ
Environment recognition with RCI and multi-timeframe analysis leading to a waiting-for-signal stance (Part 3)
https://www.youtube.com/watch?v=C6DHn0lD-I4
Environment recognition with RCI and multi-timeframe analysis leading to a waiting-for-signal stance (Part 4)
https://www.youtube.com/watch?v=QG1iNTnLyyQ
Environment recognition with RCI and multi-timeframe analysis leading to a waiting-for-signal stance (Part 5)
https://www.youtube.com/watch?v=VYlGiy6Cllg
× ![]()


