

An example of trend reversal seen from the sign "RCI3 main line + mBDSR" (AUD/JPY 5-minute chart)
0
BODSOR (mBDSR)The sales page ishere.
※ BODSOR and mBDSR are indicators developed to improve entry accuracy when using RC I3-line for pullback buying or pullback selling.
The figure below is a 5-minute chart of AUDJPY.
AUDJPY 5-minute chart (March 7, 2019)
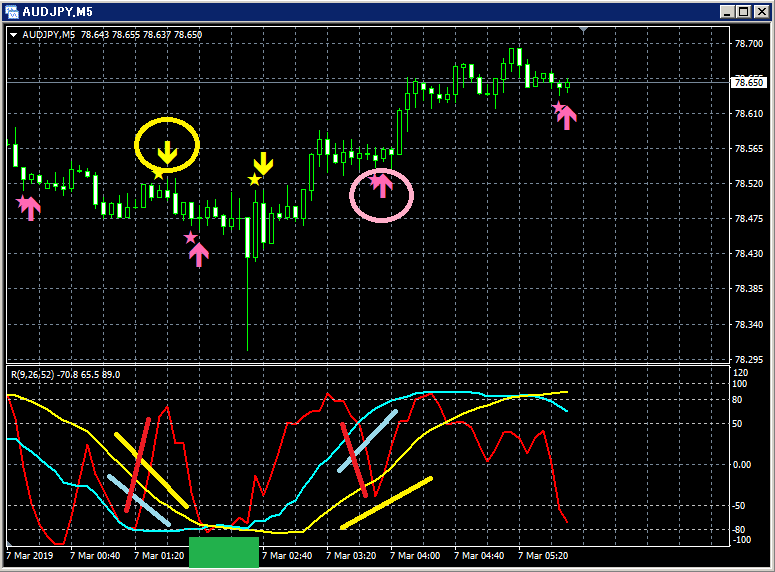
Top row:mBDSR
Bottom row: RC I3 lines (red: RCI9, light blue: RCI26, yellow: RCI52)
(1) Sell-on-rally signal
Among the three RC I lines, only RCI9 is clearly rising.
If RCI9 turns down, all three RC I lines may decline, indicating a potential strong price drop.
In other words, the price may drop sharply.
In such a situation,mBDSR's sell-on-rally signal (yellow arrow circled) lights up.
Afterwards, the price is seen to fall smoothly. .
(2) Drop close to the RCI3 bottom
After dropping to a shape close to the so-called "RCI3 bottom," the price rises.
(3) Buy-on-dip signal
Among the three RC I lines, only RCI9 is clearly falling.
If RCI9 turns up, all three RC I lines may rise, indicating a potential price rise.
In other words, the price may rise strongly.
In such a situation,mBDSR's buy-on-dip signal (pink arrow circled) lights up
.
It can be seen that the price subsequently rises smoothly. .
Regarding the buy-on-dip signal described above, it is a common pattern where the RCI3 bottom (or near it) is followed by a rise in RCI9.
Aiming for the retracement after a rise in RCI9 from the RCI3 bottom (near it).

Twitter
https://twitter.com/RCIX3Line
Blog
http://bodsor.blog.fc2.com/
Investment Navi+
https://fx-on.com/navi/serial/?id=359
YouTube
https://www.youtube.com/channel/UCL-g5uAlesiWVJEDtWlFvGw
Examples of buy-on-dip and sell-on-rally signals on the USD/JPY 1-hour chart
※In the charts in this article, for convenience of explanation, there may be additions of circles, lines, or rectangles.
Please understand.
× ![]()


