

Master RCI to the extreme!! RCI filter of mBDSR and moving average filter (6) GBPJPY 15-minute chart
【Master RCI!! Trend Reversals, Buy on Dips, Sell on Rallies】
Indicator that shines when combined with RCI: 【BODSOR・mBDSR】
and methods & case studies (PDF) ★GogoJungle AWARD2020 winner★
https://www.gogojungle.co.jp/tools/indicators/11836
※This product【BODSOR・mBDSR】includes over 550 PDFs (totaling over 1,950 pages, over 1,900 chart images, and over 690,000 characters) as methods & case studies.
About the PDFs included in the above product
Regarding the 358 PDFs included with【BODSOR・mBDSR】
https://www.gogojungle.co.jp/finance/navi/articles/34271
【Master RCI and Win!!】Summary of PDFs containing explanations about mBDSR (Moving Average Filter)
https://www.gogojungle.co.jp/finance/navi/articles/90127
【Master RCI and Win!!】追加PDFs for trading using 5-minute chart signs (Day Trading)
https://www.gogojungle.co.jp/finance/navi/articles/89870
【Master RCI and Win!!】PDF collection for short-term 1-minute chart scalping
https://www.gogojungle.co.jp/finance/navi/articles/88762
【Master RCI and Win!!】Summary of PDFs explaining profit-taking points
https://www.gogojungle.co.jp/finance/navi/articles/89471
PDF collection for effectively utilizing R1R2S2【Master RCI and Win!!】
https://www.gogojungle.co.jp/finance/navi/articles/93154
【Master RCI and Win!!】PDF collection to effectively use the MT5 version of mBDSR
https://www.gogojungle.co.jp/finance/navi/articles/84918
mBDSR (RCI Filter)andmBDSR (Moving Average Filter)serve different roles. The accompanying PDFs also discuss how to differentiate their use.
Below,mBDSR (RCI Filter)andmBDSR (Moving Average Filter)will be shown on charts with signals from both filters.
GBPJPY 15-minute chart
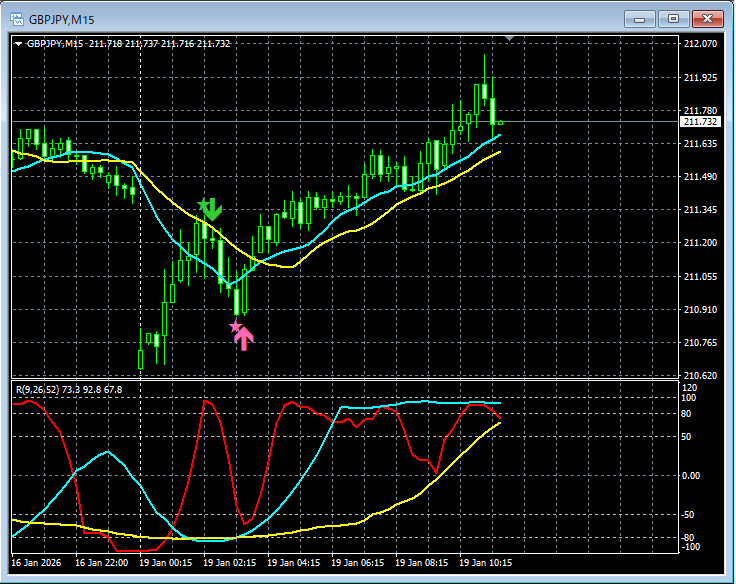
In the chart above,signals from mBDSR (RCI two-filter + MA filter)light up at timely moments.
When using the Moving Average Filter in mBDSRalsocombining with higher-timeframe down to lower-timeframe using the three RCI linesoffers high-probability trades. Explanations for this are also in the attached PDFs.
※The charts shown in this article may include added circles, lines, or boxes for explanatory convenience, please note.
Indicator that shines when combined with RCI【BODSOR・mBDSR】
and methods & case studies (PDF) ★GogoJungle AWARD2020 winner★
https://www.gogojungle.co.jp/tools/indicators/11836
Includes over 550 PDF files (methods & case studies: totaling over 1,950 pages and over 690,000 characters).
Most of them are examples that logically link higher and lower timeframes using the RCI three-line approach, progressively considering multiple lower-timeframe scenarios, and ultimately waiting for dips (buy) or rallies (sell) signals on the lower timeframes via mBDSR signals.
In addition,there are many that focus on capturing points where multiple entry justifications coincide.There are also materials that explore signals using the RCI three-line approach to identify upward or downward targets.
In the PDF explanations,
more than 1,900 charts are used..

Blacksun Indicators (List)
https://www.gogojungle.co.jp/finance/navi/articles/33779
Free Blacksun indicators and free eBooks
https://www.gogojungle.co.jp/finance/navi/articles/90181
【Reference Videos (RCI and mBDSR related)】
Environment recognition using RCI and multi-timeframe analysis to reach the point of waiting for a sign (Part 1)
https://www.youtube.com/watch?v=1prvET_M5mA
Environment recognition using RCI and multi-timeframe analysis to reach the point of waiting for a sign (Part 2)
https://www.youtube.com/watch?v=vR4oD-oMVQQ
Environment recognition using RCI and multi-timeframe analysis to reach the point of waiting for a sign (Part 3)
https://www.youtube.com/watch?v=C6DHn0lD-I4
Environment recognition using RCI and multi-timeframe analysis to reach the point of waiting for a sign (Part 4)
https://www.youtube.com/watch?v=QG1iNTnLyyQ
Environment recognition using RCI and multi-timeframe analysis to reach the point of waiting for a sign (Part 5)
https://www.youtube.com/watch?v=VYlGiy6Cllg
× ![]()


