

[Master RCI to the extreme!!] mBDSR's RCI filter and moving average filter (5) Nikkei 225 5-minute chart
【Mastering RCI!! Trend Reversal, Buy on Dips, Sell on Rallies】
Indicator【BODSOR・mBDSR】that shines when used with RCI
and its methods and case studies (PDF) ★GogoJungle AWARD2020 winner★
https://www.gogojungle.co.jp/tools/indicators/11836
Note: This product【BODSOR・mBDSR】includes over 550 PDFs (totaling over 1,950 pages, over 1,900 chart images, and over 690,000 characters) as methods and case studies.
About the PDFs included with the above product
358 PDF files included with【BODSOR・mBDSR】
https://www.gogojungle.co.jp/finance/navi/articles/34271
Summary of PDFs with explanations for the mBDSR (Movement Average Filter) in【Mastering RCI!!】
https://www.gogojungle.co.jp/finance/navi/articles/90127
【Mastering RCI!!】5-minute chart trading PDFs (Day Trading) collection
https://www.gogojungle.co.jp/finance/navi/articles/89870
【Mastering RCI!!】1-minute short-term trading (Scalping) PDFs
https://www.gogojungle.co.jp/finance/navi/articles/88762
【Mastering RCI!!】Summary of PDFs explaining profit-taking points
https://www.gogojungle.co.jp/finance/navi/articles/89471
PDF collection for effectively using R1R2S2【Mastering RCI!!】
https://www.gogojungle.co.jp/finance/navi/articles/93154
【Mastering RCI!!】PDF collection for effectively using MT5 version of mBDSR
https://www.gogojungle.co.jp/finance/navi/articles/84918
mBDSR (RCI filter)andmBDSR (Moving Average filter)serve different roles. The usage distinctions are covered in the included PDFs.
Below we will introduce charts displaying signals from bothmBDSR (RCI filter)andmBDSR (Moving Average filter)on the same chart.
Nikkei Average JP225 5-minute chart
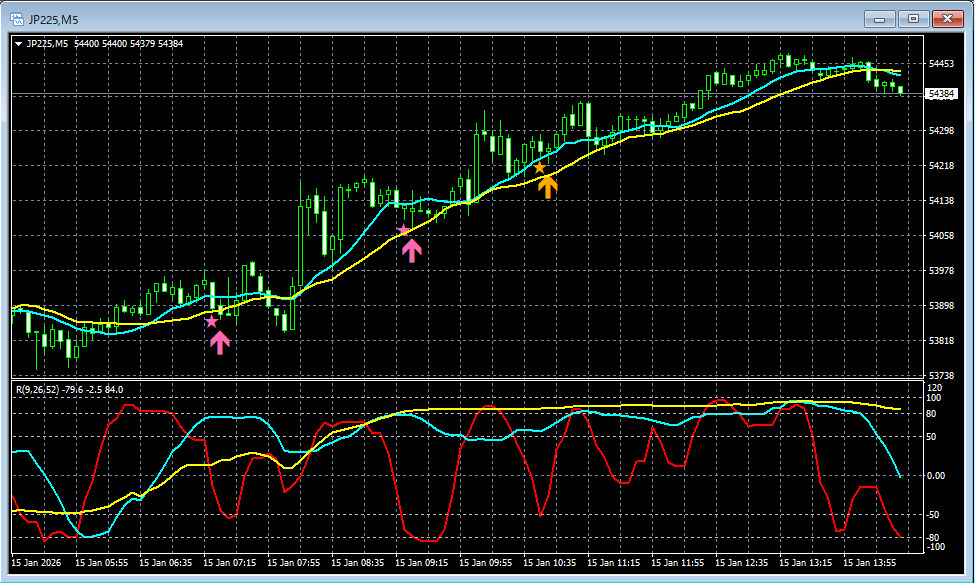
In the above chart,signals from mBDSR (RCI two-line filter and moving average filter)light up at timely moments.
For the Moving Average Filter mBDSRalsowhen combined with the concept of higher-time-frame down to lower-time-frame analyses using the three RCI linesit enables high-probability trades. The PDFs included discuss this as well.
Note: In the charts mentioned in this article, for clarity, circles, lines, and boxes may have been drawn; please understand this.
Indicator【BODSOR・mBDSR】that shines when used with RCI
and its methods and case studies (PDF) ★GogoJungle AWARD2020 winner★
https://www.gogojungle.co.jp/tools/indicators/11836
Includes over 550 PDF files (methods and case studies: total over 1,950 pages, over 690,000 characters).
Most of these are the result of logically linking higher and lower timeframes using the RCI three-line system, examining multiple lower-timeframe conditions step by step, and ultimately waiting for dips or pullbacks on the lower timeframes (i.e., signals from mBDSR).
Additionally,many PDFs focus on capturing points where multiple entry reasons overlap.There are also materials that explore rising and falling targets using the RCI three-line method.
In the PDFs’ explanations,
over 1,900 charts are used.

Blacksun Indicators (List)
https://www.gogojungle.co.jp/finance/navi/articles/33779
Blacksun Free Indicators and Free E-Books
https://www.gogojungle.co.jp/finance/navi/articles/90181
【Reference Videos (RCI and mBDSR related)】
Environmental recognition with RCI and multi-timeframe analysis to bring signals to a waiting state (1)
https://www.youtube.com/watch?v=1prvET_M5mA
Environmental recognition with RCI and multi-timeframe analysis to bring signals to a waiting state (2)
https://www.youtube.com/watch?v=vR4oD-oMVQQ
Environmental recognition with RCI and multi-timeframe analysis to bring signals to a waiting state (3)
https://www.youtube.com/watch?v=C6DHn0lD-I4
Environmental recognition with RCI and multi-timeframe analysis to bring signals to a waiting state (4)
https://www.youtube.com/watch?v=QG1iNTnLyyQ
Environmental recognition with RCI and multi-timeframe analysis to bring signals to a waiting state (5)
https://www.youtube.com/watch?v=VYlGiy6Cllg
× ![]()


