

[Master RCI to conquer with moving average filter!!] Today's Nikkei 225 5-minute chart mBDSR signal
【Master RCI!! Trend Reversal, Pullback Buy, and Pullback Sell】
Indicator that shines when combined with RCI: 【BODSOR・mBDSR】
Methods and case studies (PDF) ★GogoJungle AWARD2020 Winner★
https://www.gogojungle.co.jp/tools/indicators/11836
※This product【BODSOR・mBDSR】includes over 550 PDFs (totaling over 1,950 pages, over 1,900 charts, and over 690,000 characters) as methods and case studies.
About the PDFs included in the above product
358 PDFs included for 【BODSOR・mBDSR】
https://www.gogojungle.co.jp/finance/navi/articles/34271
【Master RCI to Win!!】A summary of PDFs describing mBDSR (Moving Average Filter)
https://www.gogojungle.co.jp/finance/navi/articles/90127
【Master RCI to Win!!】PDF collection for trading using 5-minute signals (Day Trading)
https://www.gogojungle.co.jp/finance/navi/articles/89870
【Master RCI to Win!!】PDF collection for short-term 1-minute scalping
https://www.gogojungle.co.jp/finance/navi/articles/88762
【Master RCI to Win!!】Summary of PDFs describing profit-taking points
https://www.gogojungle.co.jp/finance/navi/articles/89471
PDF collection for effectively using R1R2S2【Master RCI to Win!!】
https://www.gogojungle.co.jp/finance/navi/articles/93154
【Master RCI to Win!!】PDF collection for effectively using MT5 version mBDSR
https://www.gogojungle.co.jp/finance/navi/articles/84918
mBDSR (RCI Filter)andmBDSR (Moving Average Filter)have different roles. The accompanying PDFs also touch on how to use these appropriately.
Below we introduce examples of signals formBDSR (Moving Average Filter)signals.
Nikkei Average JP225 5-minute chart
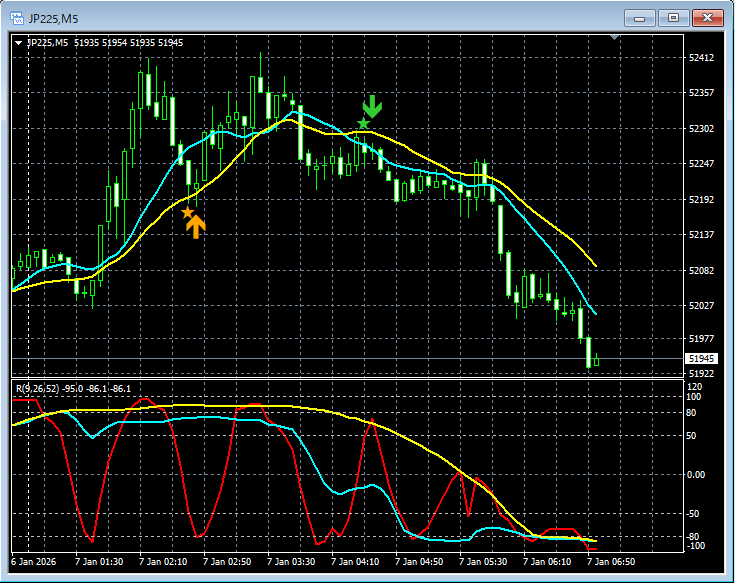
On the above chart,the mBDSR (Moving Average Filter) signallights up at timely moments.
In the case of the Moving Average Filter mBDSRas well,when used in conjunction with the higher-timeframe to lower-timeframe alignment using three RCI lines, it enables higher probability trades. This area is also explained in the accompanying PDF.
※ Please note that to facilitate explanation, charts in this article may include added circles, lines, or rectangles.
Indicator that shines when combined with RCI【BODSOR・mBDSR】
Methods and case studies (PDF) ★GogoJungle AWARD2020 Winner★
https://www.gogojungle.co.jp/tools/indicators/11836
Includes over 550 PDF files (Methods and case studies: over 1,950 pages, over 690,000 characters).
Many of these documents are structured to logically link higher and lower timeframes using three RCI lines, allowing sequential analysis of multiple lower-timeframe conditions, ultimately waiting for pullbacks or pullback buys at the lower timeframe (i.e., mBDSR signals).This is how they are summarized.
Also,many emphasize identifying points where multiple entry reasons coincide.There are many examples of this.
Additionally,there are methods that explore upper and lower targets using three RCI lines.These are included as well.
In the explanations within the PDFs,over 1,900 chartsare used.

Blacksun Indicators (List)
https://www.gogojungle.co.jp/finance/navi/articles/33779
Free Blacksun indicators and free e-books
https://www.gogojungle.co.jp/finance/navi/articles/90181
【Reference Videos (RCI and mBDSR related)】
Environment recognition using RCI and multi-timeframe analysis to bring it to a form waiting for the signal (1)
https://www.youtube.com/watch?v=1prvET_M5mA
Environment recognition using RCI and multi-timeframe analysis to wait for the signal (2)
https://www.gogojungle.co.jp/watch/1168
Environment recognition using RCI and multi-timeframe analysis to wait for the signal (3)
https://www.youtube.com/watch?v=C6DHn0lD-I4
Environment recognition using RCI and multi-timeframe analysis to wait for the signal (4)
https://www.youtube.com/watch?v=QG1iNTnLyyQ
Environment recognition using RCI and multi-timeframe analysis to wait for the signal (5)
https://www.youtube.com/watch?v=VYlGiy6Cllg
× ![]()


