

【Strike RCI to the extreme!!】 Last Friday's EURCAD 5-minute chart The previous high and the mBDSR signal
【Mastering RCI!! Trend Reversal, Buy on Dips, Sell on Rallies】
Indicator 【BODSOR・mBDSR】 that shines in combination with RCI
and methods・case studies (PDF) ★GogoJungle AWARD2020 Winner★
https://www.gogojungle.co.jp/tools/indicators/11836
The product includes more than 550 PDFs (totaling over 1,950 pages, over 1,900 chart images, and over 690,000 words) as methods and case studies.
About the PDFs included with the above product
【BODSOR・mBDSR】 358 included PDF files
https://www.gogojungle.co.jp/finance/navi/articles/34271
【Mastering RCI!!】 Summary of PDFs describing mBDSR (Moving Average Filter)
https://www.gogojungle.co.jp/finance/navi/articles/90127
【Mastering RCI!!】 Additional PDFs for trading using 5-minute signals (Day Trading)
https://www.gogojungle.co.jp/finance/navi/articles/89870
【Mastering RCI!!】 PDFs for short-term 1-minute scalping
https://www.gogojungle.co.jp/finance/navi/articles/88762
【Mastering RCI!!】 Summary of PDFs explaining profit-taking points
https://www.gogojungle.co.jp/finance/navi/articles/89471
PDF collection to effectively utilize R1R2S2【Mastering RCI!!】
https://www.gogojungle.co.jp/finance/navi/articles/93154
【Mastering RCI!!】 PDF collection for effectively using MT5 version of mBDSR
https://www.gogojungle.co.jp/finance/navi/articles/84918
EUR/CAD – Euro vs Canadian Dollar – EURCAD 5-minute chart
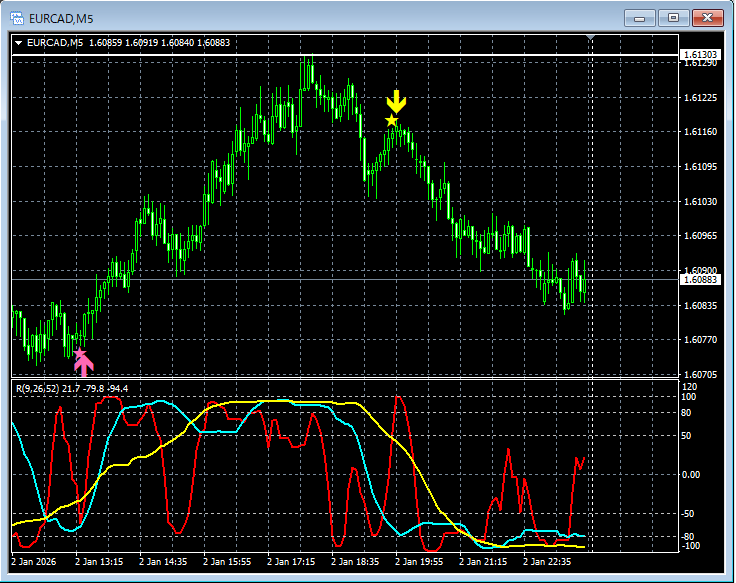
mBDSR (Two RCI filters)Signals
In the above chart,it rose close to the previous highand then pulled back.The signal from mBDSR (two RCI filters)is lighting up at the right timing.
Indicator that shines in combination with RCI: 【BODSOR・mBDSR】
and methods・case studies (PDF) ★GogoJungle AWARD2020 Winner★
https://www.gogojungle.co.jp/tools/indicators/11836
More than 550 PDF files (methods & case studies: over 1,950 pages, over 690,000 words) are included.
Many of them aresummaries of how to link higher and lower timeframes logically using three RCI lines, sequentially examining the conditions of multiple lower timeframes, and ultimately waiting for dips or pullbacks (i.e., mBDSR signals) on the lower timeframesas described.
Also,many emphasize identifying points where multiple entry reasons overlapas well.
Additionally,there are methods that explore ascent targets and descent targets using three RCI linesas well.
In the PDF explanations,over 1,900 chartsare used.

Blacksun Indicators (List)
https://www.gogojungle.co.jp/finance/navi/articles/33779
About Blacksun free indicators and free e-books
https://www.gogojungle.co.jp/finance/navi/articles/90181
【Reference Videos (RCI and mBDSR related)】
Environment recognition with RCI and multi-time-frame analysis to wait for a signal (1)
https://www.youtube.com/watch?v=1prvET_M5mA
Environment recognition with RCI and multi-time-frame analysis to wait for a signal (2)
https://www.gogojungle.co.jp/watch/1168
Environment recognition with RCI and multi-time-frame analysis to wait for a signal (3)
https://www.youtube.com/watch?v=C6DHn0lD-I4
Environment recognition with RCI and multi-time-frame analysis to wait for a signal (4)
https://www.youtube.com/watch?v=QG1iNTnLyyQ
Environment recognition with RCI and multi-time-frame analysis to wait for a signal (5)
https://www.youtube.com/watch?v=VYlGiy6Cllg
× ![]()


