

【Master RCI to the Extreme!!】Today’s Kiwi Yen NZDJPY 5-minute chart and 4-hour EMA21 bounce signals and mBDSR signals
【Mastering RCI!! Trend Reversal, Buy-on-Dips, and Sell on Retracements】
Indicator that shines in combination with RCI: 【BODSOR・mBDSR】
and methods and case studies (PDF) ★GogoJungle AWARD 2020 Winner★
https://www.gogojungle.co.jp/tools/indicators/11836
This product【BODSOR・mBDSR】includes more than 550 PDFs (totaling over 1,950 pages, over 1,900 chart images, and over 690,000 words) as methods and case studies.
About the PDFs included with the above product
358 PDF files included for 【BODSOR・mBDSR】
https://www.gogojungle.co.jp/finance/navi/articles/34271
【Mastering RCI and Winning!!】Summary of PDFs with explanations about mBDSR (Moving Average Filter)
https://www.gogojungle.co.jp/finance/navi/articles/90127
【New PDFs for Mastering RCI and Winning!!】Collection of PDFs for trading using 5-minute chart signals (Day trading)
https://www.gogojungle.co.jp/finance/navi/articles/89870
【Mastering RCI and Winning!!】Collection of PDFs for short-term 1-minute chart scalping
https://www.gogojungle.co.jp/finance/navi/articles/88762
【Mastering RCI and Winning!!】Summary of PDFs explaining profit-taking points
https://www.gogojungle.co.jp/finance/navi/articles/89471
PDF collection to effectively use R1R2S2【Mastering RCI and Winning!!】
https://www.gogojungle.co.jp/finance/navi/articles/93154
【Mastering RCI and Winning!!】PDF collection to effectively use MT5 version of mBDSR
https://www.gogojungle.co.jp/finance/navi/articles/84918
Kiwi Yen NZDJPY 5-minute Chart
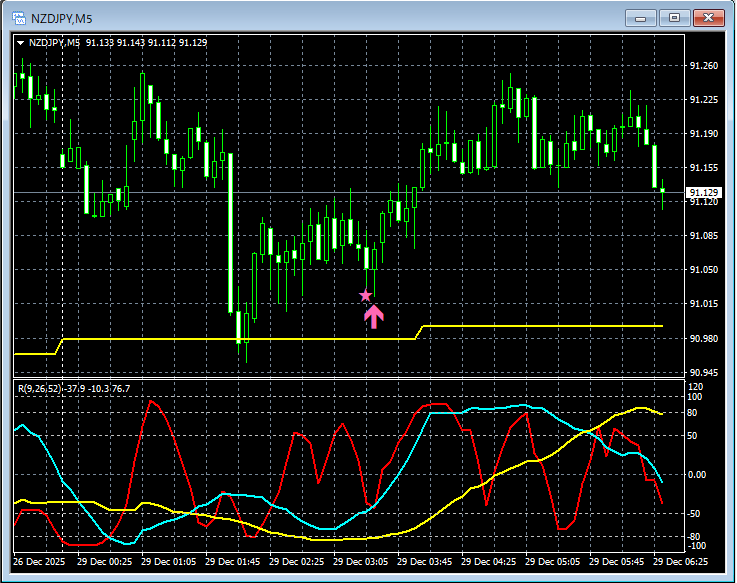
mBDSR (Two-RCI Filters)Signals
In the above chart,near EMA21 on the 4-hour chartafter a rebound, during the declinethe signals of mBDSR (Two-RCI Filters)light up at the right timing.
Indicator that shines in combination with RCI【BODSOR・mBDSR】
and methods and case studies (PDF) ★GogoJungle AWARD 2020 Winner★
https://www.gogojungle.co.jp/tools/indicators/11836
550+ PDF files (methods and case studies: over 1,950 pages, over 690,000 words) are included.
Many of them areexamples that analyze multiple lower-timeframe conditions logically by linking upper and lower timeframes using the RCI 3-line method, and finally waiting for dip-buy or pullback-sell timing (i.e., mBDSR signals) on the lower timeframe.
Also,many focus on capturing points where multiple entry reasons coincide..
Additionally,method using RCI 3-line to explore upside and downside targets is included..
In the PDF explanations,over 1,900 charts are used..

Blacksun Indicators (List)
https://www.gogojungle.co.jp/finance/navi/articles/33779
About Blacksun free indicators and free e-books
https://www.gogojungle.co.jp/finance/navi/articles/90181
【Reference videos (RCI and mBDSR related)】
Environmental awareness with RCI and multi-time-frame analysis to get signals (1)
https://www.youtube.com/watch?v=1prvET_M5mA
Environmental awareness with RCI and multi-time-frame analysis to get signals (2)
https://www.gogojungle.co.jp/watch/1168
Environmental awareness with RCI and multi-time-frame analysis to get signals (3)
https://www.youtube.com/watch?v=C6DHn0lD-I4
Environmental awareness with RCI and multi-time-frame analysis to get signals (4)
https://www.youtube.com/watch?v=QG1iNTnLyyQ
Environmental awareness with RCI and multi-time-frame analysis to get signals (5)
https://www.youtube.com/watch?v=VYlGiy6Cllg
× ![]()


