

【RCI3 Three-line + mBDSR】 After the return-sell signal lights up on the 5-minute chart, it also on the 1-minute chart. USDCAD
0
BODSOR (mBDSR)The sales page isHere.
※ BODSOR and mBDSR are indicators developed to improve entry precision when using the RC I3-line for buying dips or selling rallies.
The figure below shows the USDCAD 5-minute and 1-minute charts.
USDCAD 5-minute chart
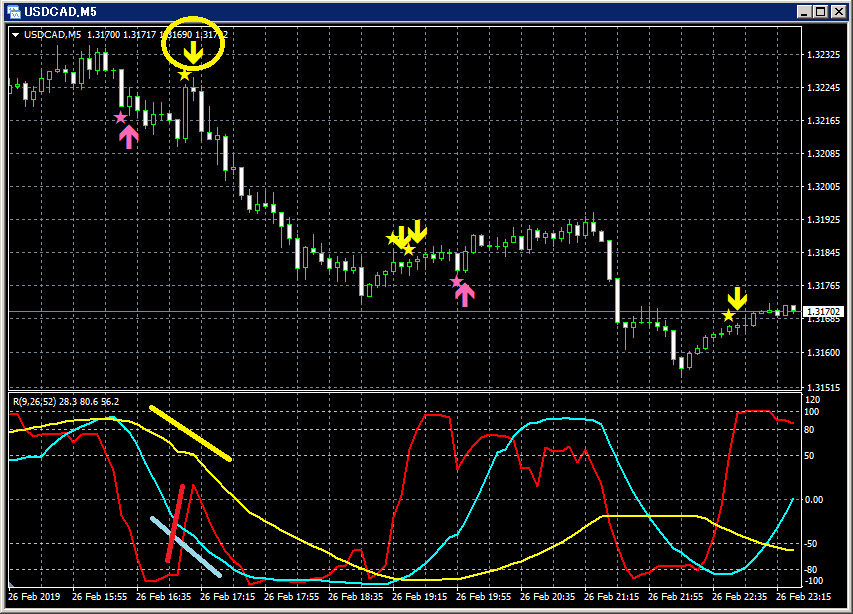
Upper panel: mBDSR
Lower panel: RCI 3-line (Red: RCI9, Light blue: RCI26, Yellow: RCI52)
USDCAD 1-minute chart
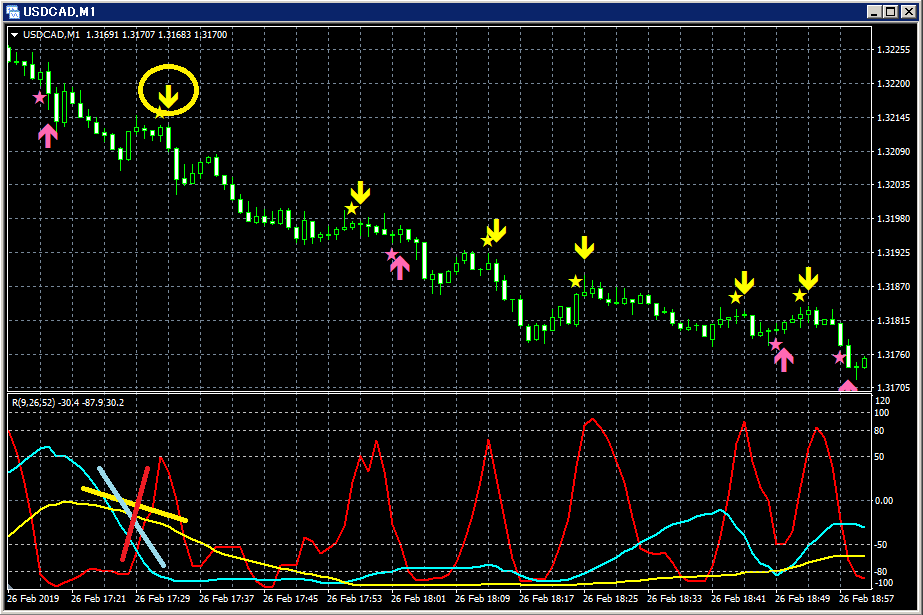
Upper panel: mBDSR
Lower panel: RCI 3-line (Red: RCI9, Light blue: RCI26, Yellow: RCI52)Among the three RCI lines, only RCI9 is clearly rising.
If RCI9 reverses downward, all three RCI lines may turn downward.
In other words, the price could also fall strongly.
In such a scenario, on both the 5-minute and 1-minute charts, mBDSR sell-on-rebound signals (yellow arrows encircled)
illuminate. Shortly after, bearish candles follow in succession, and the price clearly declines.
BODSOR (mBDSR) sales page isHere.

Twitter
https://twitter.com/RCIX3Line
Blog
http://bodsor.blog.fc2.com/
Investment Navi+
https://fx-on.com/navi/serial/?id=359
YouTube
https://www.youtube.com/channel/UCL-g5uAlesiWVJEDtWlFvGw
Examples of buy-on-dip and sell-on-rally signals for USD/JPY on the 1-hour chart
※ Please note that in this article's charts, for ease of explanation, circles, straight lines, and boxes may be drawn or added.
Thank you for understanding.
× ![]()


