

[Master RCI to Win with Moving Average Filter!!] Today's USD/JPY 1-minute chart mBDSR signal
Blacksun Indicator (List)
https://www.gogojungle.co.jp/finance/navi/articles/33779
About Blacksun Free Indicators and Free E-Books
https://www.gogojungle.co.jp/finance/navi/articles/90181
【Reference Videos (RCI and mBDSR related)】
Bring the signals by applying RCI to environmental recognition and multi-time-frame analysis (1)
https://www.youtube.com/watch?v=1prvET_M5mA
Bring the signals by applying RCI to environmental recognition and multi-time-frame analysis (2)
https://www.gogojungle.co.jp/watch/1168
Bring the signals by applying RCI to environmental recognition and multi-time-frame analysis (3)
https://www.youtube.com/watch?v=C6DHn0lD-I4
Bring the signals by applying RCI to environmental recognition and multi-time-frame analysis (4)
https://www.youtube.com/watch?v=QG1iNTnLyyQ
Bring the signals by applying RCI to environmental recognition and multi-time-frame analysis (5)
https://www.youtube.com/watch?v=VYlGiy6Cllg
=================
【Mastering RCI!! Trend Reversal, Buy-the-Dip, and Sell-the-Rally】
An indicator that shines when combined with RCI【BODSOR・mBDSR】
and Methods・Case Studies (PDF) ★GogoJungle AWARD2020 Winner★
https://www.gogojungle.co.jp/tools/indicators/11836
※This product【BODSOR・mBDSR】includes over 550 PDFs ( totaling over 1,950 pages, over 1,900 chart images, over 690,000 words) as manuals/case studies.
mBDSR (RCI Filter)andmBDSR (Moving Average Filter)serve different roles. The usage distinctions are covered in the included PDF.
mBDSR (Moving Average Filter)For the file name and title of PDFs that explain this, please see the following Investment Navi+ article.
【Master RCI and Win!!】Summary of PDFs explaining mBDSR (Moving Average Filter)
https://www.gogojungle.co.jp/finance/navi/articles/90127
Below, we introduce examples of signals formBDSR (Moving Average Filter)signals.
USD/JPY 1-minute chart
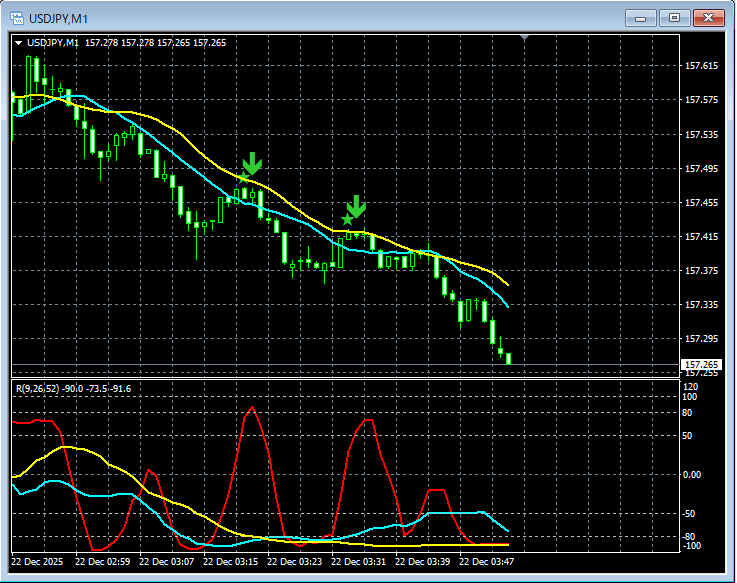
In the chart above,signals from mBDSR (Moving Average Filter)light up at the right timing.
In the case of the Moving Average Filter mBDSRas well,When used in conjunction with the top-down view based on three RCI linesto analyze lower timeframes, it enables high-probability trades. This is also explained in theincluded PDF.
※Please note that in the charts presented in this article, some circles, lines, and boxes may be added for explanatory ease.
An indicator that shines when combined with RCI【BODSOR・mBDSR】
and Methods・Case Studies (PDF) ★GogoJungle AWARD2020 Winner★
https://www.gogojungle.co.jp/tools/indicators/11836
550+ PDF files (Methods・Case Studies: total over 1,950 pages, over 690,000 words) are included.
Many of these are designed tologically link higher and lower timeframes using three RCI lines, then sequentially analyze multiple lower-timeframe conditions, ultimately waiting for pullbacks/buys on lower timeframes (i.e., mBDSR signals)..
Additionally,there are many resources focusing on identifying points where multiple entry reasons converge..
Furthermore,the method for exploring upside/downside targets using three RCI lines is included..
The PDFs describeover 1,900 chartsthat are used.


