

[Mastering RCI to the Extreme!!] Nikkei Average JP225 4-hour chart signals from mBDSR
Blacksun Indicator (List)
https://www.gogojungle.co.jp/finance/navi/articles/33779
About Blacksun's Free Indicators and Free E-books
https://www.gogojungle.co.jp/finance/navi/articles/90181
【Reference videos (RCI and mBDSR related)】
Bring into the shot with RCI-based environment recognition and multi-timeframe analysis (1)
https://www.youtube.com/watch?v=1prvET_M5mA
Bring into the shot with RCI-based environment recognition and multi-timeframe analysis (2)
https://www.gogojungle.co.jp/watch/1168
Bring into the shot with RCI-based environment recognition and multi-timeframe analysis (3)
https://www.youtube.com/watch?v=C6DHn0lD-I4
Bring into the shot with RCI-based environment recognition and multi-timeframe analysis (4)
https://www.youtube.com/watch?v=QG1iNTnLyyQ
Bring into the shot with RCI-based environment recognition and multi-timeframe analysis (5)
https://www.youtube.com/watch?v=VYlGiy6Cllg
============================================
【Mastering RCI!! Trend Reversal, Buy the Dip, Sell the Rally】
An indicator that shines when used with RCI: [BODSOR・mBDSR]
Method and case study (PDF) ★GogoJungle AWARD2020 Winner★
https://www.gogojungle.co.jp/tools/indicators/11836
Nikkei Average JP225 4-hour frame
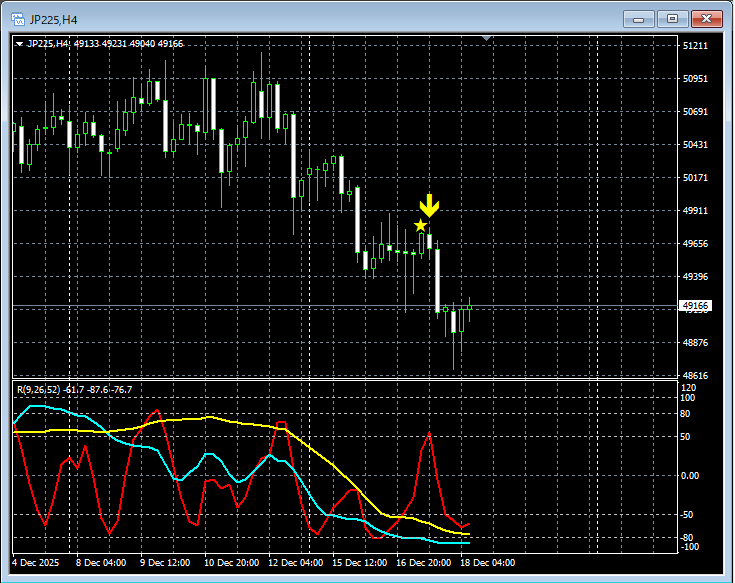
mBDSR (RCI two-filter)Signal
In the chart above,the signal of mBDSR (RCI two-filter)lights up at the right timing.
An indicator that shines when used with RCI: [BODSOR・mBDSR]
Method and case study (PDF) ★GogoJungle AWARD2020 Winner★
https://www.gogojungle.co.jp/tools/indicators/11836
More than 550 PDF files (Methods and case studies: over 1,950 pages, over 690,000 words) are included.
Many of them aresummaries of how to logically link higher and lower timeframes using three RCI lines, examining multiple lower-timeframe conditions step by step, and ultimately waiting for dip-buying or pullback selling timing (i.e., mBDSR signals) on the lower timeframes..
Also,many focus on catching points where multiple entry reasons coincide..
Additionally,there are methods exploring potential upside and downside targets using three RCI lines..
In the PDF explanations,more than 1,900 chartsare used.

× ![]()


