

【RCI3 Single Line + mBDSR】 Crude Oil Futures 4-Hour Chart Retracement Sell Signal
0
BODSOR (mBDSR)The sales page forhere.
※ BODSOR and mBDSR are indicators developed to improve entry accuracy when using the RC I3-line for buying on pullbacks or selling on retracements.
The figure below is a four-hour chart of Crude Oil futures.
Crude Oil futures four-hour chart
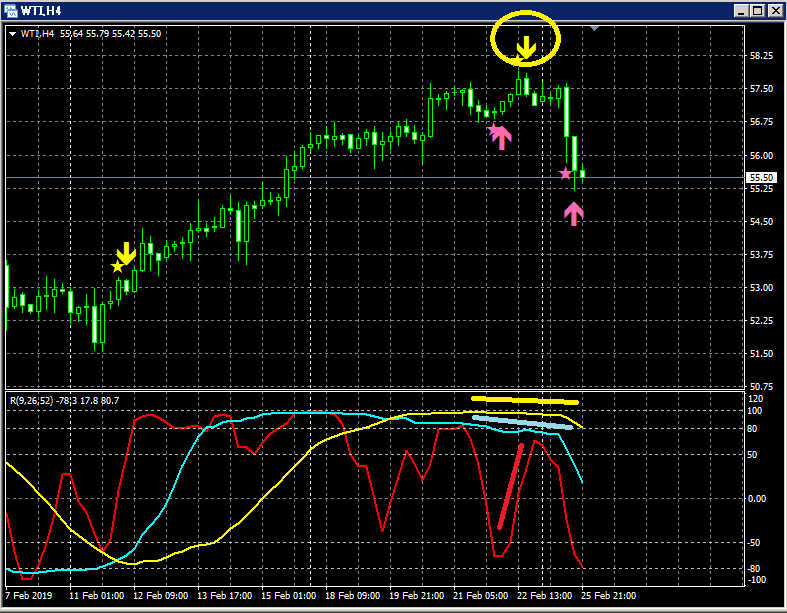
Upper section:mBDSR
Among the three RCI lines, only RCI9 is clearly rising.
If RCI9 reverses downward, all three RCI lines may decline together.
In other words, the price could also fall sharply.
In such a situation,the mBDSR’s pullback sell signal (yellow arrows circled in a circle) lights up andis
on.
In this example, immediately after the pullback sell signal, two bearish candles appeared in succession, suggesting a timely resumption of the decline was well captured.
BODSOR (mBDSR) sales page ishere.

Twitter
https://twitter.com/RCIX3Line
Blog
http://bodsor.blog.fc2.com/
Investment Navi Plus
https://fx-on.com/navi/serial/?id=359
YouTube
https://www.youtube.com/channel/UCL-g5uAlesiWVJEDtWlFvGw
Examples of pullback buying and retracement selling signals on USD/JPY 1-hour chart
※In the charts in this article, for convenience of explanation, yen marks, straight lines, and squares may be drawn, so please understand.
ご了承ください。
× ![]()


