

【Master RCI to Win!!】AUDUSD 30-minute chart mBDSR signal
Blacksun Indicator (List)
https://www.gogojungle.co.jp/finance/navi/articles/33779
About Blacksun's Free Indicators and Free E-Books
https://www.gogojungle.co.jp/finance/navi/articles/90181
【Reference Videos (RCI and mBDSR related)】
Bring the signal to a setup using environment recognition with RCI and multi-time-frame analysis (1)
https://www.youtube.com/watch?v=1prvET_M5mA
Bring the signal to a setup using environment recognition with RCI and multi-time-frame analysis (2)
https://www.gogojungle.co.jp/watch/1168
Bring the signal to a setup using environment recognition with RCI and multi-time-frame analysis (3)
https://www.youtube.com/watch?v=C6DHn0lD-I4
Bring the signal to a setup using environment recognition with RCI and multi-time-frame analysis (4)
https://www.youtube.com/watch?v=QG1iNTnLyyQ
Bring the signal to a setup using environment recognition with RCI and multi-time-frame analysis (5)
https://www.youtube.com/watch?v=VYlGiy6Cllg
=================
【Mastering RCI!! Trend Reversals, Buy on Dips, Sell on Rallies】
An indicator that excels when combined with RCI:【BODSOR・mBDSR】
and Method / Case Studies (PDF) ★GogoJungle AWARD2020 winner★
https://www.gogojungle.co.jp/tools/indicators/11836
AUD/USD 30-minute chart
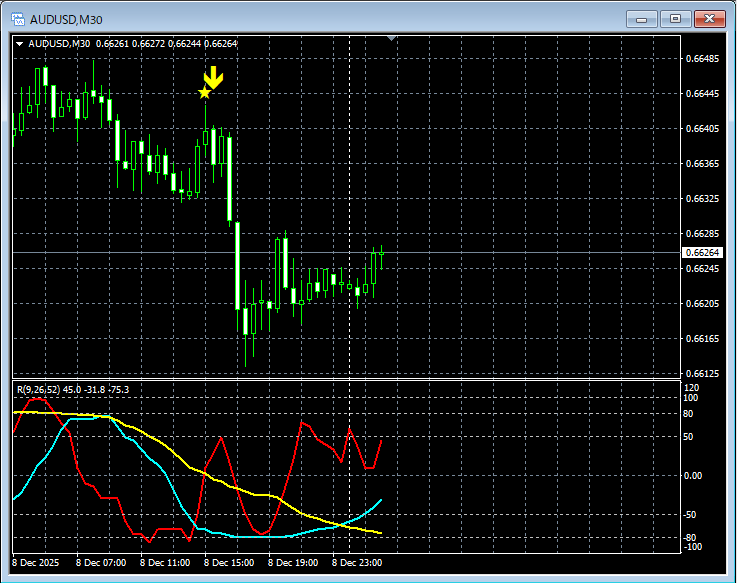
mBDSR (RCI two-filter)signal
In the chart above,the signal of mBDSR (RCI two-filter)lights up at the right timing.
An indicator that excels when combined with RCI【BODSOR・mBDSR】
and Method / Case Studies (PDF) ★GogoJungle AWARD2020 winner★
https://www.gogojungle.co.jp/tools/indicators/11836
More than 550 PDFs are included (Methods and Case Studies: over 1,950 pages, over 690,000 words).
Many of them areexamples that break down how to logically link higher and lower timeframes using three RCI lines, then examine multiple lower-timeframe conditions sequentially, ultimately waiting for dips or buy entries at pullbacks (i.e., the mBDSR signals)..
Additionally,many focus on capturing points where multiple entry criteria overlap..
Also included is a method to explore upside and downside targets using three RCI lines.
In the PDF descriptions,over 1,900 chartsare used.

× ![]()


