

【Master RCI to Victory!!】GBP/JPY 15-minute chart mBDSR signal
Blacksun Indicator (List)
https://www.gogojungle.co.jp/finance/navi/articles/33779
Free Blacksun indicators and free e-book
https://www.gogojungle.co.jp/finance/navi/articles/90181
【Reference videos (RCI and mBDSR related)】
Bring the signals to the point of waiting for a signal using RCI-based environment recognition and multi-timeframe analysis (1)
https://www.youtube.com/watch?v=1prvET_M5mA
Bring the signals to the point of waiting for a signal using RCI-based environment recognition and multi-timeframe analysis (2)
https://www.gogojungle.co.jp/watch/1168
Bring the signals to the point of waiting for a signal using RCI-based environment recognition and multi-timeframe analysis (3)
https://www.youtube.com/watch?v=C6DHn0lD-I4
Bring the signals to the point of waiting for a signal using RCI-based environment recognition and multi-timeframe analysis (4)
https://www.youtube.com/watch?v=QG1iNTnLyyQ
Bring the signals to the point of waiting for a signal using RCI-based environment recognition and multi-timeframe analysis (5)
https://www.youtube.com/watch?v=VYlGiy6Cllg
===============================================
【Mastering RCI!! Trend reversal, pullback buying, and pullback selling】
An indicator that shines when combined with RCI【BODSOR・mBDSR】
and methods & case studies (PDF) ★GogoJungle AWARD 2020 winner★
https://www.gogojungle.co.jp/tools/indicators/11836
GBP/JPY 15-minute chart
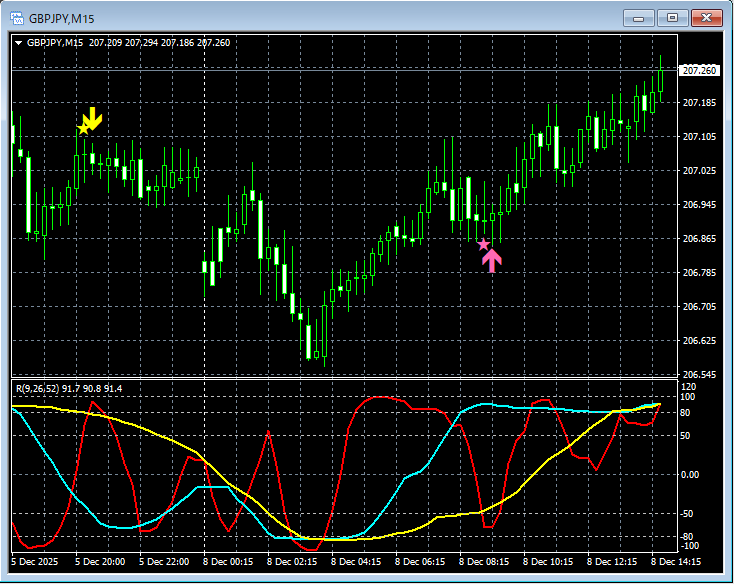
mBDSR (RCI 2-move filter)Signals
In the chart above,the signals of mBDSR (RCI 2-move filter)are clearly lighting up at the right timing.
An indicator that shines when combined with RCI【BODSOR・mBDSR】
and methods & case studies (PDF) ★GogoJungle AWARD 2020 winner★
https://www.gogojungle.co.jp/tools/indicators/11836
More than 550 PDF files are included (methods & case studies: over 1,950 pages, over 690,000 characters).
Many of thesedocument how, by using three RCI lines to logically link higher and lower timeframes, multiple lower-timeframe conditions are sequentially considered, ultimately waiting for pullback buying or pullback selling signals on the lower timeframe (i.e., mBDSR signals).
Additionally,many focus on pinpointing points where multiple entry reasons coincide.There are many such cases.
Furthermore,the method also includes exploring potential targets for upward and downward moves using three RCI lines..
In the PDF explanations,over 1,900 charts are used..

× ![]()


