

Battle-hardened【Master RCI to win with moving average filter!!】Canadian Dollar/Japanese Yen 5-min chart mBDSR signal
Blacksun Indicator (List)
https://www.gogojungle.co.jp/finance/navi/articles/33779
Free Blacksun indicators and free e-books
https://www.gogojungle.co.jp/finance/navi/articles/90181
【Reference videos (RCI and mBDSR related)】
Bring into a form that anticipates signals with environment recognition using RCI and multi-timeframe analysis (1)
https://www.youtube.com/watch?v=1prvET_M5mA
Bring into a form that anticipates signals with environment recognition using RCI and multi-timeframe analysis (2)
https://www.gogojungle.co.jp/watch/1168
Bring into a form that anticipates signals with environment recognition using RCI and multi-timeframe analysis (3)
https://www.youtube.com/watch?v=C6DHn0lD-I4
Bring into a form that anticipates signals with environment recognition using RCI and multi-timeframe analysis (4)
https://www.youtube.com/watch?v=QG1iNTnLyyQ
Bring into a form that anticipates signals with environment recognition using RCI and multi-timeframe analysis (5)
https://www.youtube.com/watch?v=VYlGiy6Cllg
=================
【Mastering RCI!! Trend Reversal, Buy on Dips, Sell on Rallies】
Indicators that shine when combined with RCI【BODSOR・mBDSR】
and methods/case studies (PDF) ★GogoJungle AWARD 2020 winner★
https://www.gogojungle.co.jp/tools/indicators/11836
※This product【BODSOR・mBDSR】comes with over 550 PDFs (methods and case studies: total over 1,950 pages, over 1,900 chart pages, over 690,000 words) as attachments.
mBDSR (RCI filter)andmBDSR (Moving Average filter)serve different roles. The usage distinctions are also covered in the attached PDF.
mBDSR (Moving Average Filter)For information on the PDF files with explanations, please see the investment navigation plus article below.
【Mastering RCI!!】Summary of PDFs that explain mBDSR (Moving Average Filter)
https://www.gogojungle.co.jp/finance/navi/articles/90127
Below, we introduce examples of signals formBDSR (Moving Average Filter)signals.
CAD/JPY 5-minute chart
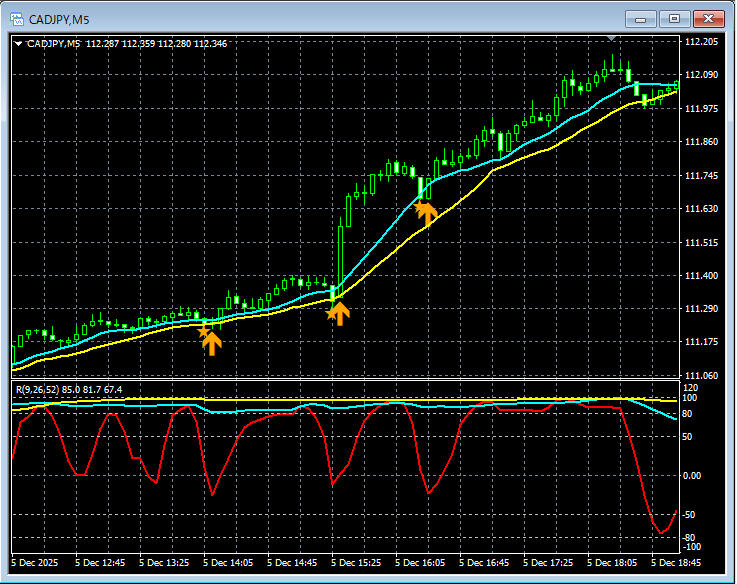
In the chart above,the signal of the moving average filter (mBDSR)lights up at the right timing.
In the case of the Moving Average Filter mBDSRas well,when combined with the consolidation of higher and lower timeframes using three RCI linesit enables trades with high edge. The attached PDF also explains this.
※ In the charts introduced in this article, for convenience of explanation, circles, straight lines, and rectangles may be drawn.
Indicators that shine when combined with RCI:【BODSOR・mBDSR】
and methods/case studies (PDF) ★GogoJungle AWARD2020 winner★
https://www.gogojungle.co.jp/tools/indicators/11836
Includes over 550 PDF files (methods and case studies: total over 1,950 pages, over 690,000 words).
Most of them are aboutlinking higher and lower timeframes logically using three RCI lines to sequentially analyze multiple lower timeframes, ultimately waiting for dip/buy or pullback sell timing (i.e., mBDSR signals) on the lower timeframesas examples.
Also,many focus on identifying points where multiple entry reasons overlap.Also included are methods that explore rising and falling targets using three RCI lines.
In the PDF explanations,
over 1,900 charts are used.


