

Worldly seasoned【Mastering RCI to win with Moving Average Filter!!】USDCAD 5-minute chart mBDSR signal
Blacksun Indicator (List)
https://www.gogojungle.co.jp/finance/navi/articles/33779
About Blacksun's Free Indicators and Free eBooks
https://www.gogojungle.co.jp/finance/navi/articles/90181
【Reference Videos (RCI and mBDSR related)】
Bringing environment recognition and multi-timeframe analysis to a stance waiting for a signal using RCI (1)
https://www.youtube.com/watch?v=1prvET_M5mA
Bringing environment recognition and multi-timeframe analysis to a stance waiting for a signal using RCI (2)
https://www.gogojungle.co.jp/watch/1168
Bringing environment recognition and multi-timeframe analysis to a stance waiting for a signal using RCI (3)
https://www.youtube.com/watch?v=C6DHn0lD-I4
Bringing environment recognition and multi-timeframe analysis to a stance waiting for a signal using RCI (4)
https://www.youtube.com/watch?v=QG1iNTnLyyQ
Bringing environment recognition and multi-timeframe analysis to a stance waiting for a signal using RCI (5)
https://www.youtube.com/watch?v=VYlGiy6Cllg
=================
【Mastering RCI!! Trend Reversal, Buy on Dips, Sell on Rallies】
Indicator that shines in combination with RCI: BODSOR and mBDSR
Methods and Case Studies (PDF) ★GogoJungle AWARD2020 Winner★
https://www.gogojungle.co.jp/tools/indicators/11836
※This product【BODSOR・mBDSR】includes over 550 PDFs as methods and case studies (totaling over 1,950 pages, more than 1,900 charts, over 690,000 words).
mBDSR (RCI Filter)andmBDSR (Moving Average Filter)have different roles. The distinctions are also discussed in the included PDF.
mBDSR (Moving Average Filter)For a PDF with explanations, please see the article below in the Investment Navi+.
【Master RCI!!】Summary of PDFs describing mBDSR (Moving Average Filter)
https://www.gogojungle.co.jp/finance/navi/articles/90127
Below, we introduce examples of signals formBDSR (Moving Average Filter)signals.
US Dollar / Canadian Dollar USDCAD 5-minute chart
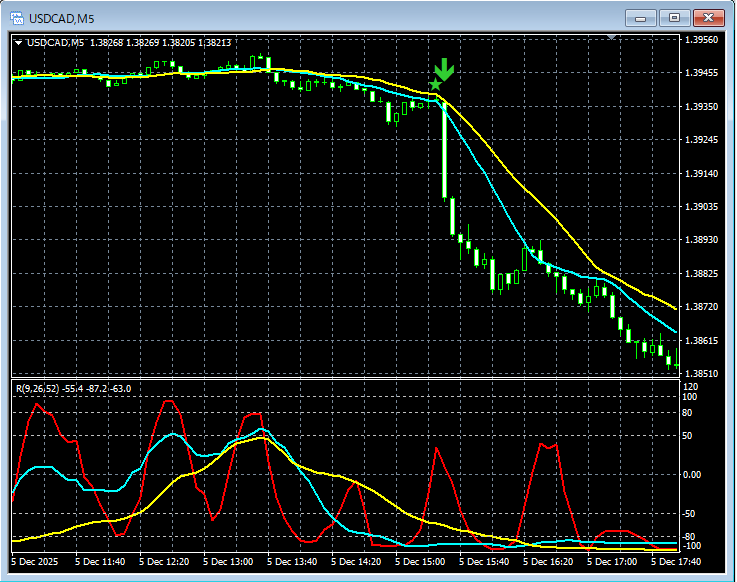
In the chart above,the mBDSR signallights up at the right timing.
For moving-average-filtered mBDSRas well,if you combine it with the down-to-up breakdown using three RCI lines on higher timeframesyou can achieve high-probability trades. This is also explained in theincluded PDF.
※Please note that in the charts shown in this article, for clarity, circles, lines, squares, and other shapes may have been added.
Indicator that shines in combination with RCI【BODSOR・mBDSR】
and the methods and case studies (PDF) ★GogoJungle AWARD2020 Winner★
https://www.gogojungle.co.jp/tools/indicators/11836
Includes more than 550 PDF files (methods and case studies: total over 1,950 pages, over 690,000 words).
Most of these are designed to logically link higher and lower timeframes using the three RCI lines, sequentially analyzing multiple lower-timeframe conditions, and ultimately waiting for a dip-buy or pullback-sell timing (i.e., the mBDSR signal) on the lower timeframe.
Additionally,many are focused on identifying overlaps of multiple entry reasons..
Furthermore,there are methods for exploring upside and downside targets using the three RCI lines..
In the PDF explanations,over 1,900 chartsare used.


