

Battle-hardened【Mastering RCI to win with moving average filter!!】USD/JPY 1-minute chart mBDSR signals
Blacksun Indicator (List)
https://www.gogojungle.co.jp/finance/navi/articles/33779
About Blacksun’s Free Indicators and Free E-Books
https://www.gogojungle.co.jp/finance/navi/articles/90181
【Reference Videos (RCI and mBDSR related)】
Environment recognition using RCI and multi-time-frame analysis to bring it to a state where you wait for a signal (1)
https://www.youtube.com/watch?v=1prvET_M5mA
Environment recognition using RCI and multi-time-frame analysis to bring it to a state where you wait for a signal (2)
https://www.gogojungle.co.jp/watch/1168
Environment recognition using RCI and multi-time-frame analysis to bring it to a state where you wait for a signal (3)
https://www.youtube.com/watch?v=C6DHn0lD-I4
Environment recognition using RCI and multi-time-frame analysis to bring it to a state where you wait for a signal (4)
https://www.youtube.com/watch?v=QG1iNTnLyyQ
Environment recognition using RCI and multi-time-frame analysis to bring it to a state where you wait for a signal (5)
https://www.youtube.com/watch?v=VYlGiy6Cllg
=========================================
【Mastering RCI!! Trend Reversals, Buy on Dips, Sell on Rallies】
An indicator that shines when combined with RCI【BODSOR・mBDSR】
and Method/Case Study (PDF) ★GogoJungle AWARD2020 Winner★
https://www.gogojungle.co.jp/tools/indicators/11836
※This product【BODSOR・mBDSR】includes over 550 PDFs as methods and case studies (totaling over 1,950 pages, over 1,900 chart images, and over 690,000 words).
mBDSR (RCI Filter)andmBDSR (Moving Average Filter)have different roles. The accompanying PDFs also discuss how to use them distinctly.
mBDSR (Moving Average Filter)For the PDF file names and titles that include explanations, please see the following Investment Navi+ article.
【Master RCI and Win!!】mBDSR (Moving Average Filter) Summary of PDFs with Explanations
https://www.gogojungle.co.jp/finance/navi/articles/90127
Below, we introduce examples of signals formBDSR (Moving Average Filter)signals.
USDJPY 1-minute chart
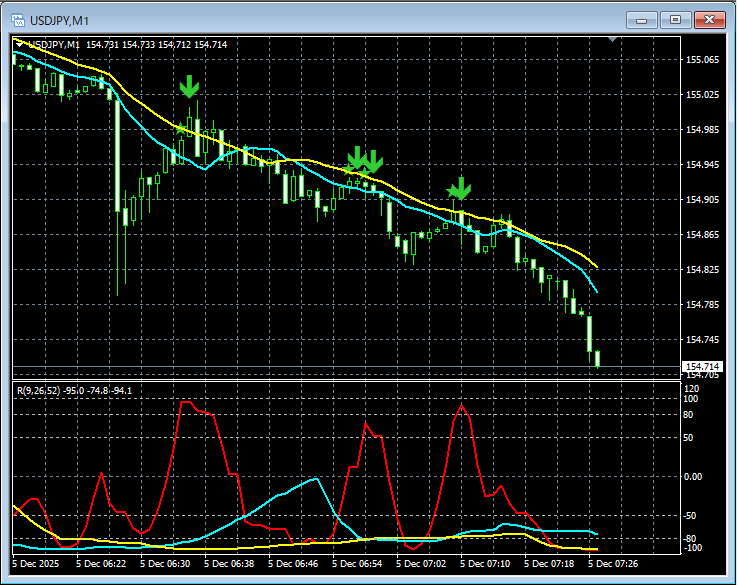
In the above chart,the signals from mBDSR (Moving Average Filter)light up at the right timings.
With the Moving Average Filter mBDSRas well,when used in conjunction with the refinement from upper-timeframe to lower-timeframe using the three RCI lines, you can execute high-probability trades. The accompanying PDF explains this as well.
※Please note that in the charts shown in this article, for readability, circles, lines, and rectangles may have been added.
The indicator that shines when combined with RCI【BODSOR・mBDSR】
and Method/Case Study (PDF) ★GogoJungle AWARD2020 Winner★
https://www.gogojungle.co.jp/tools/indicators/11836
Includes over 550 PDF files (Methods and Case Studies: totaling over 1,950 pages, over 690,000 words).
Most of these are compiled to show a logical link between upper and lower time frames using the three RCI lines, analyzing multiple lower time frames in sequence, and ultimately waiting for a dip-buy or pullback-sell signal on the lower time frame (i.e., an mBDSR signal).
Also,many of them emphasize identifying points where multiple entry reasons coincide.There are also many that explore methods to identify signals for rising or falling targets using the three RCI lines.
In the PDF explanations,
over 1,900 chartsare used.


