

Battle-hardened [Mastering RCI to win with Moving Average Filter!!] EUR/USD 15-minute chart mBDSR signal
Blacksun Indicators (List)
https://www.gogojungle.co.jp/finance/navi/articles/33779
About Blacksun's Free Indicators and Free eBooks
https://www.gogojungle.co.jp/finance/navi/articles/90181
【Reference Videos (RCI and mBDSR related)】
Bring the environment recognition and multi-time-frame analysis using RCI to the point of waiting for a signal (1)
https://www.youtube.com/watch?v=1prvET_M5mA
Bring the environment recognition and multi-time-frame analysis using RCI to the point of waiting for a signal (2)
https://www.gogojungle.co.jp/watch/1168
Bring the environment recognition and multi-time-frame analysis using RCI to the point of waiting for a signal (3)
https://www.youtube.com/watch?v=C6DHn0lD-I4
Bring the environment recognition and multi-time-frame analysis using RCI to the point of waiting for a signal (4)
https://www.youtube.com/watch?v=QG1iNTnLyyQ
Bring the environment recognition and multi-time-frame analysis using RCI to the point of waiting for a signal (5)
https://www.youtube.com/watch?v=VYlGiy6Cllg
=================
【Mastering RCI!! Trend Reversal, Buy on Dips, Sell on Rises】
Indicator that shines in combination with RCI【BODSOR・mBDSR】
Methods and Case Studies (PDF) ★GogoJungle AWARD 2020 winner★
https://www.gogojungle.co.jp/tools/indicators/11836
※This product【BODSOR・mBDSR】includes more than 550 PDFs (totaling over 1,950 pages, over 1,900 charts, and more than 690,000 characters) as part of the methods and case studies.
mBDSR (RCI Filter)andmBDSR (Moving Average Filter)have different roles. The use of these is also discussed in the included PDF.
mBDSR (Moving Average Filter)For the PDF file names and titles that explain about it, please see the following Investment Navi+ article.
【Master RCI!!】 Summary of PDFs explaining mBDSR (Moving Average Filter)
https://www.gogojungle.co.jp/finance/navi/articles/90127
Below, we introduce examples of signals formBDSR (Moving Average Filter)signals.
EURUSD – 15-minute chart
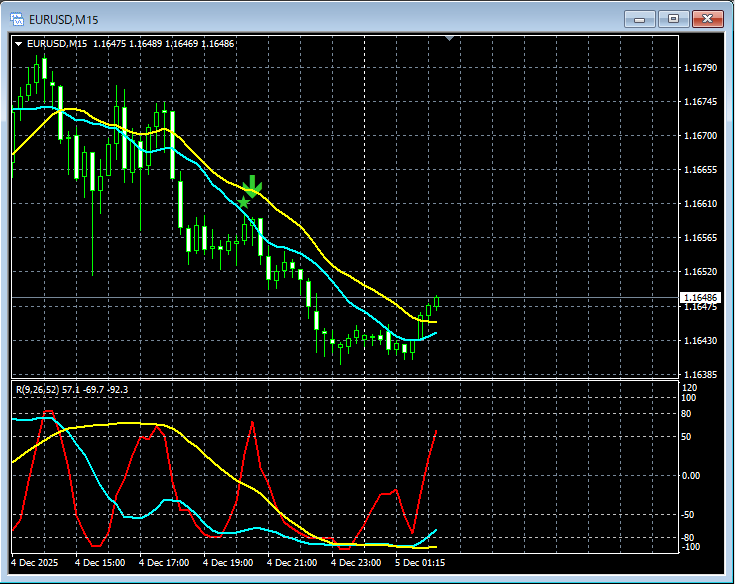
In the chart above,signal from mBDSR (Moving Average Filter)lights up at the right timing.
In the case of the Moving Average Filter mBDSRas well,when used in conjunction with the higher time frame down to the lower time frame using three RCI linesit enables high-probability trades. This is also explained in the included PDF.
Note: for ease of explanation, charts in this article may include circles, straight lines, or rectangles.
Indicator that shines in combination with RCI【BODSOR・mBDSR】
Methods and Case Studies (PDF) ★GogoJungle AWARD2020 winner★
https://www.gogojungle.co.jp/tools/indicators/11836
Includes more than 550 PDF files (Methods and Case Studies: over 1,950 pages, over 690,000 characters).
Most of them areexamples of logically linking higher and lower time frames using the three RCI lines to analyze the status of multiple lower time frames sequentially, ultimately waiting for dips in the lower time frame or sell-offs at retracements (i.e., signals of mBDSR).This is the essence.
Also,many focus on pinpointing points where multiple entry reasons align.There are also many such examples.
In addition,there are methods to explore upward targets and downside targets using three RCI lines.These are also included.
In the PDF explanations,more than 1,900 charts are used..


