

Battle-hardened【Mastering RCI to win with a moving average filter!!】AUDUSD 30-minute chart mBDSR sign
Blacksun Indicator (List)
https://www.gogojungle.co.jp/finance/navi/articles/33779
About Blacksun's Free Indicators and Free eBooks
https://www.gogojungle.co.jp/finance/navi/articles/90181
【Reference Videos (RCI and mBDSR related)】
Bring yourself to the signal waiting stage with environment recognition and multi-timeframe analysis using RCI (1)
https://www.youtube.com/watch?v=1prvET_M5mA
Bring yourself to the signal waiting stage with environment recognition and multi-timeframe analysis using RCI (2)
https://www.gogojungle.co.jp/watch/1168
Bring yourself to the signal waiting stage with environment recognition and multi-timeframe analysis using RCI (3)
https://www.youtube.com/watch?v=C6DHn0lD-I4
Bring yourself to the signal waiting stage with environment recognition and multi-timeframe analysis using RCI (4)
https://www.youtube.com/watch?v=QG1iNTnLyyQ
Bring yourself to the signal waiting stage with environment recognition and multi-timeframe analysis using RCI (5)
https://www.youtube.com/watch?v=VYlGiy6Cllg
=================
【Mastering RCI!! Trend Reversal, Buy on Dips, Sell on Rallies】
An indicator that shines in combination with RCI【BODSOR・mBDSR】
Methods and Case Studies (PDF) ★GogoJungle AWARD 2020 Winner★
https://www.gogojungle.co.jp/tools/indicators/11836
※This product【BODSOR・mBDSR】comes with more than 550 PDFs (Total 1,950 pages, over 1,900 charts, over 690,000 words) as part of the methods and case studies.
mBDSR (RCI filter)andmBDSR (Moving Average filter)have different roles. The accompanying PDFs also discuss how to use them distinctively.
mBDSR (Moving Average Filter)For PDFs with explanations about this, please refer to the investment navigation+ article below for the file name and title.
【Master RCI and Win!!】Summary of PDFs explaining mBDSR (Moving Average Filter)
https://www.gogojungle.co.jp/finance/navi/articles/90127
Below, we introduce examples of signals formBDSR (Moving Average Filter)signals.
AUD/USD 30-minute chart
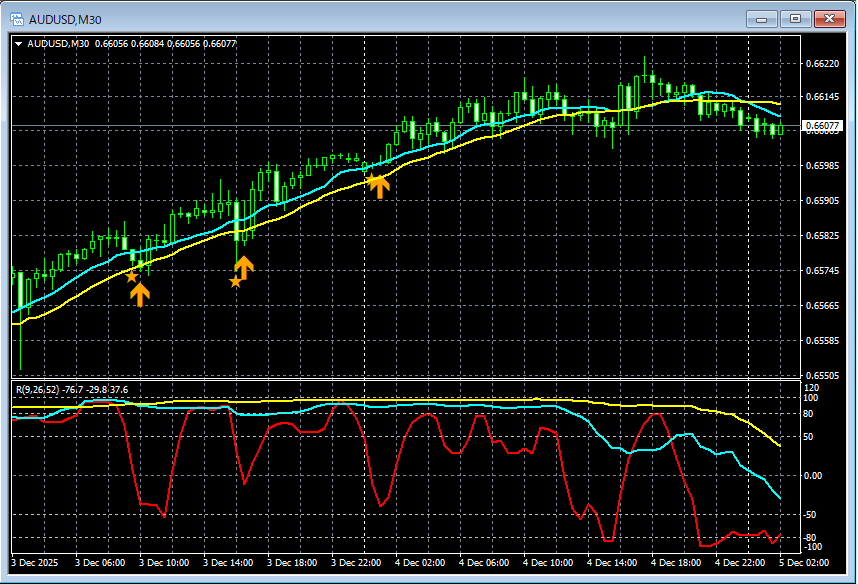
In the chart above,the signal from mBDSR (Moving Average Filter)lights up at the right timing.
In the case of the Moving Average Filter mBDSRas well,by combining with RCI's three-line hierarchy from higher to lower timeframesyou can achieve high-probability trades. The accompanying PDFs explain this as well.
※ Please note that in the charts shown in this article, for convenience of explanation, circles, straight lines, and rectangles may have been added.
An indicator with strong power when combined with RCI【BODSOR・mBDSR】
Methods and Case Studies (PDF) ★GogoJungle AWARD 2020 Winner★
https://www.gogojungle.co.jp/tools/indicators/11836
It includes more than 550 PDF files (Methods/Case Studies: total over 1,950 pages, over 690,000 words).
Most of them are designed to logically link higher and lower timeframes using three RCI lines, sequentially examining the状况 of multiple lower timeframes, and ultimately waiting for a dip buy or a pullback sell timing (the mBDSR signals) on lower timeframes.Also,
many are focused on identifying points where multiple entry rationale overlap.There are also many examples that explore ascending and descending targets using the three-RCI-line method.
In the PDFs,
over 1,900 charts are used.


