

Master RCI to win extremely!! USD/JPY 4-hour chart mBDSR sign
Blacksun Indicator (List)
https://www.gogojungle.co.jp/finance/navi/articles/33779
About Blacksun Free Indicators and Free E-books
https://www.gogojungle.co.jp/finance/navi/articles/90181
【Reference Videos (Related to RCI and mBDSR)】
Bring the environment recognition and multi-time-frame analysis using RCI to the point of waiting for a signal (1)
https://www.youtube.com/watch?v=1prvET_M5mA
Bring the environment recognition and multi-time-frame analysis using RCI to the point of waiting for a signal (2)
https://www.gogojungle.co.jp/watch/1168
Bring the environment recognition and multi-time-frame analysis using RCI to the point of waiting for a signal (3)
https://www.youtube.com/watch?v=C6DHn0lD-I4
Bring the environment recognition and multi-time-frame analysis using RCI to the point of waiting for a signal (4)
https://www.youtube.com/watch?v=QG1iNTnLyyQ
Bring the environment recognition and multi-time-frame analysis using RCI to the point of waiting for a signal (5)
https://www.youtube.com/watch?v=VYlGiy6Cllg
=================
【Mastering RCI!! Trend Reversal, Buy the Dip, Sell the Rally】
An indicator that shines in combination with RCI【BODSOR・mBDSR】
and method / case studies (PDF) ★GogoJungle AWARD 2020 Winner★
https://www.gogojungle.co.jp/tools/indicators/11836
USDJPY 4-hour chart
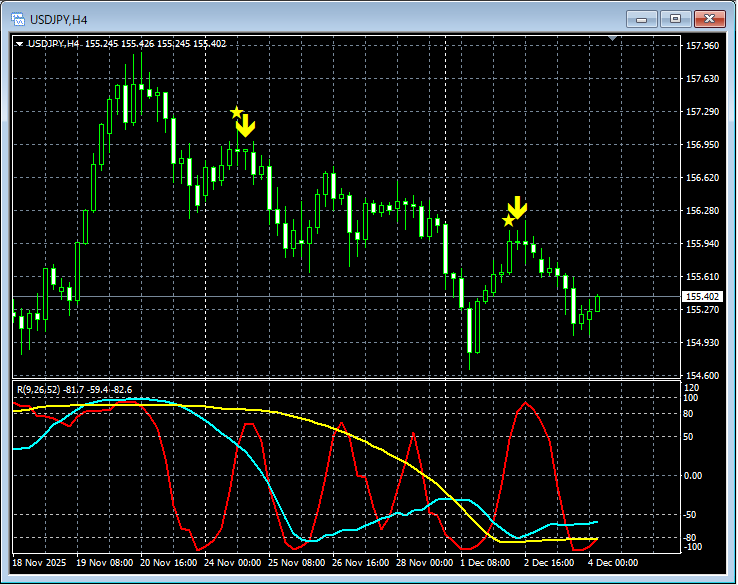
mBDSR (Two-RCI filter) signal
On the chart above,the mBDSR (two RCI filters) signalis lighting up at the right timing.
An indicator that shines in combination with RCI【BODSOR・mBDSR】
and method / case studies (PDF) ★GogoJungle AWARD 2020 Winner★
https://www.gogojungle.co.jp/tools/indicators/11836
More than 550 PDF files (methods and case studies: over 1,950 pages, over 690,000 characters) are included.
Many of them areexamples that break down situations on multiple lower timeframes by logically linking higher and lower timeframes using three RCI lines, ultimately waiting for pullbacks or rallies on the lower timeframes (i.e., mBDSR signals).
Also,many focus on capturing points where multiple entry reasons overlap.
Additionally,it includes methods for exploring upside and downside targets using three RCI lines.
In the PDF explanations,over 1,900 chartsare used.

× ![]()


