

Gold XAUUSD mBDSR signal From yesterday's chart (2025/11/28)
Blacksun Indicator (List)
https://www.gogojungle.co.jp/finance/navi/articles/33779
About Blacksun's Free Indicators and Free E-Books
https://www.gogojungle.co.jp/finance/navi/articles/90181
【Reference Videos (RCI and mBDSR related)】
Bring together environmental recognition and multi-timeframe analysis to wait for signals using RCI (1)
https://www.youtube.com/watch?v=1prvET_M5mA
Bring together environmental recognition and multi-timeframe analysis to wait for signals using RCI (2)
https://www.gogojungle.co.jp/watch/1168
Bring together environmental recognition and multi-timeframe analysis to wait for signals using RCI (3)
https://www.youtube.com/watch?v=C6DHn0lD-I4
Bring together environmental recognition and multi-timeframe analysis to wait for signals using RCI (4)
https://www.youtube.com/watch?v=QG1iNTnLyyQ
Bring together environmental recognition and multi-timeframe analysis to wait for signals using RCI (5)
https://www.youtube.com/watch?v=VYlGiy6Cllg
=================
【Mastering RCI!! Trend Reversal, Buy on Dips, Sell on Rallies】
An indicator that shines in combination with RCI【BODSOR・mBDSR】
and Method / Case Studies (PDF) ★GogoJungle AWARD 2020 Winner★
https://www.gogojungle.co.jp/tools/indicators/11836
GOLD XAUUSD 15-minute chart
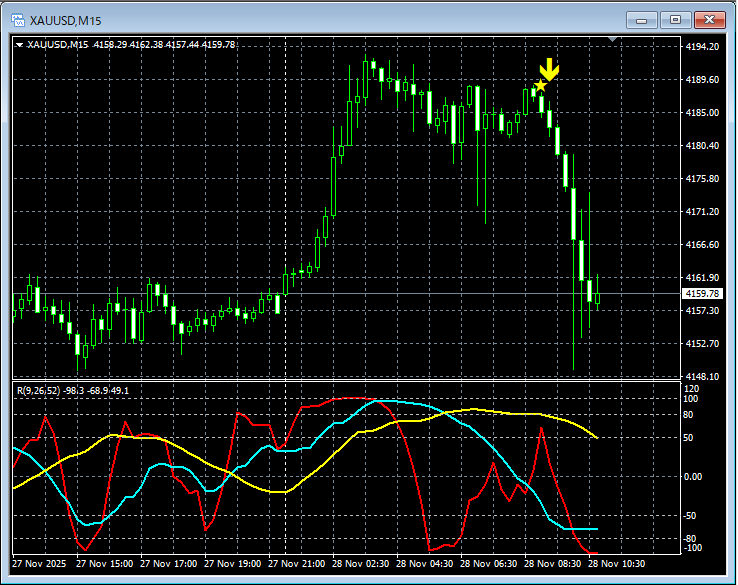
mBDSR (RCI two-line filter)Signal
In the chart above,the mBDSR (RCI two-line filter) signalis lighting up at the right timing.
An indicator that shines in combination with RCI【BODSOR・mBDSR】
and Method / Case Studies (PDF) ★GogoJungle AWARD 2020 Winner★
https://www.gogojungle.co.jp/tools/indicators/11836
Over 550 PDF files (Methods & Case Studies: over 1,950 pages, over 690,000 characters) are included.
Many of them aresummaries of the approach where you logically link higher and lower timeframes using an RCI three-line study to sequentially analyze several lower-timeframe conditions, finally waiting for a dip-buy or pullback-sell timing (i.e., a signal from mBDSR) on the lower timeframe.
Also,many focus on capturing points where multiple entry grounds overlap.
Additionally,there are methods that explore upside and downside targets using three-line RCI.
In the PDF explanations,more than 1,900 chartsare used.

× ![]()


