

Master RCI to the utmost!! Use both the signals of mBDSR (moving average filter) and R1R2S2
Blacksun Indicators (List)
https://www.gogojungle.co.jp/finance/navi/articles/33779
About Blacksun's Free Indicators and Free E-books
https://www.gogojungle.co.jp/finance/navi/articles/90181
【Reference videos (RCI and mbDSR related)】
Environment recognition using RCI and multi-timeframe analysis to bring it to the point of waiting for a signal (1)
https://www.youtube.com/watch?v=1prvET_M5mA
Environment recognition using RCI and multi-timeframe analysis to bring it to the point of waiting for a signal (2)
https://www.gogojungle.co.jp/watch/1168
Environment recognition using RCI and multi-timeframe analysis to bring it to the point of waiting for a signal (3)
https://www.youtube.com/watch?v=C6DHn0lD-I4
Environment recognition using RCI and multi-timeframe analysis to bring it to the point of waiting for a signal (4)
https://www.youtube.com/watch?v=QG1iNTnLyyQ
Environment recognition using RCI and multi-timeframe analysis to bring it to the point of waiting for a signal (5)
https://www.youtube.com/watch?v=VYlGiy6Cllg
=================
【Master RCI!! Trend Reversal, Buy on Dips, Sell on Rallies】
An indicator that shines in combination with RCI【BODSOR・mBDSR】
and its method and case study (PDF) ★GogoJungle AWARD 2020 Winner★
https://www.gogojungle.co.jp/tools/indicators/11836
R1R2S2is included in the above product. For details, please read the Investment Navi+ article below.
RCI 3-line "Two-stage Confirmation" to target trend reversals, dips, and rallies—R1R2S2 released!!
※This product【BODSOR・mBDSR】includes over 550 PDFs (study methods and case studies: over 1,950 pages, over 69,000 charts, over 690,000 words).
※Also includes 31 PDFs to effectively use R1R2S2 (study methods and case studies: over 120 pages, over 115 charts, over 40,000 words).
PDF collection to effectively utilize R1R2S2【Master RCI to Win!!】
https://www.gogojungle.co.jp/finance/navi/articles/93154
For the file names and titles of the PDFs to effectively utilize R1R2S2, please refer to the above Investment Navi+ article.
Also,mBDSR (RCI filter)andmBDSR (Moving Average filter)have different roles. The accompanying PDFs also cover how to use them appropriately.
mBDSR (Moving Average Filter)For PDFs explaining this, please see the Investment Navi+ article below.
【Master RCI to Win!!】Summary of PDFs Explaining mBDSR (Moving Average Filter)
https://www.gogojungle.co.jp/finance/navi/articles/90127
Below,mBDSR (Moving Average Filter)andR1R2S2will be shown with signals displayed simultaneously.
GBPUSD 5-minute chart
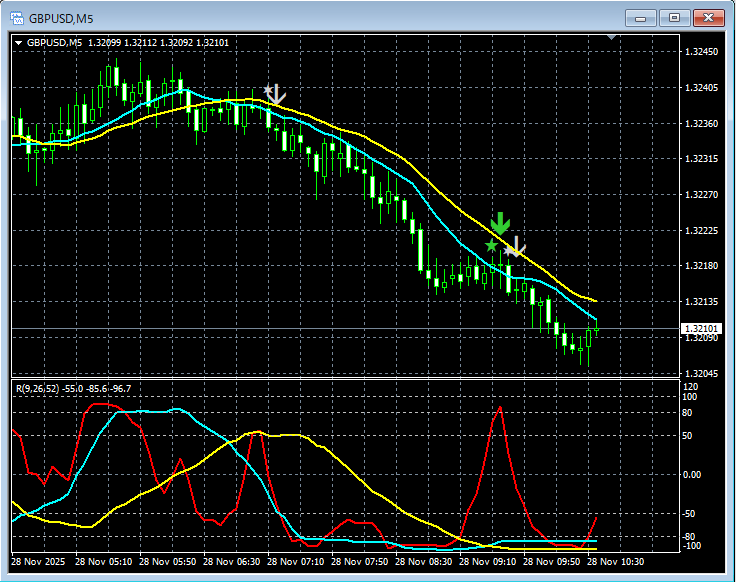
mBDSR (MA two-filter)andR1R2S2
In the above chart,mBDSR (MA two-filter)andR1R2S2signals light up in a timely manner.
Using the three RCI linesto drop from higher to lower timeframes andWait for the lights of mBDSRto come on,If the mBDSR signal does not light up or is missed or delayed,the R1R2S2 signalmay be able to respond, andR1R2S2is often used in conjunction withmBDSR.Indictor that shines with combination with RCI【BODSOR・mBDSR】and its method and case study (PDF) ★GogoJungle AWARD 2020★https://www.gogojungle.co.jp/tools/indicators/11836Includes more than 550 PDFs (study methods and case studies: over 1,950 pages, over 690,000 words).Most of them are organized around logically linking higher and lower timeframes using the three-line RCI to sequentially analyze the status of multiple lower timeframes, ultimately waiting for dips or rallies signals (i.e., mBDSR signals) on the lower timeframe.Also,many focus on identifying points where multiple entry reasons coincide.There are also pieces that explore how to identify upside and downside targets using the three-line RCI.In the PDF explanations,over 1,900 chartsare used.the R1R2S2 signalmay be able to respond, andR1R2S2is often used in conjunction withmBDSR.
Indictor that shines with combination with RCI【BODSOR・mBDSR】
and its method and case study (PDF) ★GogoJungle AWARD 2020★
https://www.gogojungle.co.jp/tools/indicators/11836
Includes more than 550 PDFs (study methods and case studies: over 1,950 pages, over 690,000 words).
Most of them are organized around logically linking higher and lower timeframes using the three-line RCI to sequentially analyze the status of multiple lower timeframes, ultimately waiting for dips or rallies signals (i.e., mBDSR signals) on the lower timeframe.
Also,many focus on identifying points where multiple entry reasons coincide.There are also pieces that explore how to identify upside and downside targets using the three-line RCI.
In the PDF explanations,over 1,900 chartsare used.

× ![]()


