

Master RCI to absolute victory!! From yesterday's USD/JPY chart
Blacksun Indicator (List)
https://www.gogojungle.co.jp/finance/navi/articles/33779
About Blacksun Free Indicators and Free E-Books
https://www.gogojungle.co.jp/finance/navi/articles/90181
【Reference videos (RCI and mbDSR related)】
Bring together the environment recognition and multi-time-frame analysis with RCI to reach the shape of waiting for a signal (1)
https://www.youtube.com/watch?v=1prvET_M5mA
Bring together the environment recognition and multi-time-frame analysis with RCI to reach the shape of waiting for a signal (2)
https://www.gogojungle.co.jp/watch/1168
Bring together the environment recognition and multi-time-frame analysis with RCI to reach the shape of waiting for a signal (3)
https://www.youtube.com/watch?v=C6DHn0lD-I4
Bring together the environment recognition and multi-time-frame analysis with RCI to reach the shape of waiting for a signal (4)
https://www.youtube.com/watch?v=QG1iNTnLyyQ
Bring together the environment recognition and multi-time-frame analysis with RCI to reach the shape of waiting for a signal (5)
https://www.youtube.com/watch?v=VYlGiy6Cllg
=================
【Mastering RCI!! Trend Reversal, Buy on Dips, Sell on Rallies】
Indicators that shine when combined with RCI【BODSOR・mbDSR】
and Methods / Case Studies (PDF) ★GogoJungle AWARD2020 Winner★
https://www.gogojungle.co.jp/tools/indicators/11836
USDJPY 1-minute chart
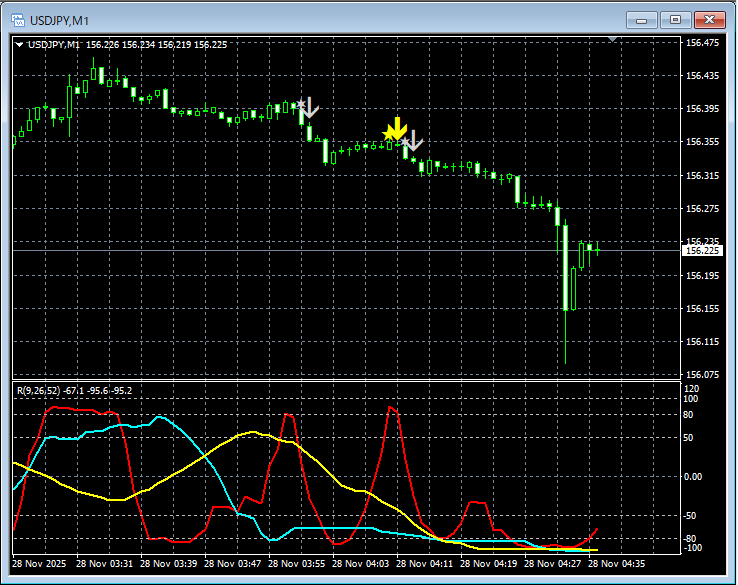
mbDSR (RCI two-line filter)andR1R2S2signals
On the above 1-minute chart,mbDSR (RCI two-line filter) and R1R2S2 signalsare lit up in timing.
Indicators that shine when combined with RCI【BODSOR・mbDSR】
and Methods / Case Studies (PDF) ★GogoJungle AWARD2020 Winner★
https://www.gogojungle.co.jp/tools/indicators/11836
More than 550 PDF files (Methods & Case Studies: over 1,950 pages, over 690,000 characters) are included.
Most of them are designed aroundusing three RCI lines to logically link higher and lower timeframes, examining the conditions of multiple lower timeframes in sequence, and ultimately waiting for the dip-buying or pullback-selling timing in the lower timeframes (i.e., mbDSR signals).This is what they are about.
Also,many focus on capturing points where multiple entry reasons coincide.There are many of these as well.
Additionally,the method for exploring upside/downside targets using three RCI lines is included.Also included.
In the PDF explanations,more than 1,900 chartsare used.

× ![]()


