

【Master RCI to the Extreme!!】Pin Bar, mBDSR, and R1R2S2 Signs
Blacksun Indicator (List)
https://www.gogojungle.co.jp/finance/navi/articles/33779
About Blacksun’s Free Indicators and Free E-books
https://www.gogojungle.co.jp/finance/navi/articles/90181
【Reference videos (RCI and mbdsr related)】
Get into a state of environmental recognition and multi-timeframe analysis using RCI to wait for a signal (1)
https://www.youtube.com/watch?v=1prvET_M5mA
Get into a state of environmental recognition and multi-timeframe analysis using RCI to wait for a signal (2)
https://www.gogojungle.co.jp/watch/1168
Get into a state of environmental recognition and multi-timeframe analysis using RCI to wait for a signal (3)
https://www.youtube.com/watch?v=C6DHn0lD-I4
Get into a state of environmental recognition and multi-timeframe analysis using RCI to wait for a signal (4)
https://www.youtube.com/watch?v=QG1iNTnLyyQ
Get into a state of environmental recognition and multi-timeframe analysis using RCI to wait for a signal (5)
https://www.youtube.com/watch?v=VYlGiy6Cllg
=================
【Mastering RCI!! Trend Reversal, Buy the Dip, and Sell the Rally】
Indicator that shines in combination with RCI【BODSOR・mBDSR】
and Method・Case Studies (PDF) ★GogoJungle AWARD2020 winner★
https://www.gogojungle.co.jp/tools/indicators/11836
Euro/OZ: EURAUD 4-hour chart
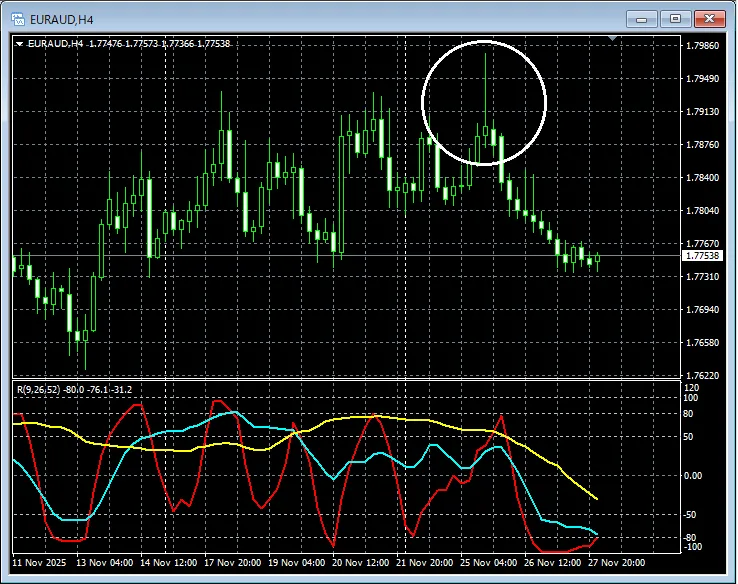
On the above 4-hour chart, a decline-reversal is suggestedLong upper-shadow pin barappears,RCI three-line all show a very weak pattern.Euro/OZ: EURAUD 15-minute chartmBDSR (RCI two-line filter)andR1R2S2signalsOn the above 1-hour chart,signals of mBDSR (RCI two-line filter) and R1R2S2light up timely, indicating a good capture of the downside reversal.Indicator that shines in combination with RCI【BODSOR・mBDSR】and Method・Case Studies (PDF) ★GogoJungle AWARD2020 winner★https://www.gogojungle.co.jp/tools/indicators/11836More than 550 PDF files (Methods and Case Studies: over 1,950 pages, over 690,000 words) are included.Many of them are designed toevaluate the multiple lower-timeframe conditions by logically linking higher and lower timeframes using the three-line RCI, eventually framing cases that wait for dip-buying on the lower timeframes or selling rallies (i.e., signals from mBDSR)..Additionally,there are many that focus on capturing points where multiple entry reasons overlap..Note that,there are also methods that explore upside/downside targets using three-line RCI..In the PDF explanations,more than 1,900 chartsare used.
Euro/OZ: EURAUD 15-minute chart
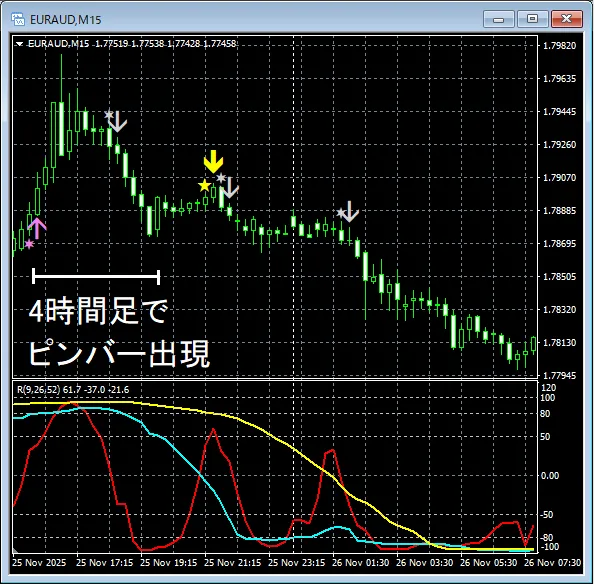
mBDSR (RCI two-line filter)andR1R2S2signals
On the above 1-hour chart,signals of mBDSR (RCI two-line filter) and R1R2S2light up timely, indicating a good capture of the downside reversal.
Indicator that shines in combination with RCI【BODSOR・mBDSR】
and Method・Case Studies (PDF) ★GogoJungle AWARD2020 winner★
https://www.gogojungle.co.jp/tools/indicators/11836
More than 550 PDF files (Methods and Case Studies: over 1,950 pages, over 690,000 words) are included.
Many of them are designed toevaluate the multiple lower-timeframe conditions by logically linking higher and lower timeframes using the three-line RCI, eventually framing cases that wait for dip-buying on the lower timeframes or selling rallies (i.e., signals from mBDSR)..
Additionally,there are many that focus on capturing points where multiple entry reasons overlap..
Note that,there are also methods that explore upside/downside targets using three-line RCI..
In the PDF explanations,more than 1,900 chartsare used.

× ![]()


