

【Master RCI!!】Pin Bar, RCI three-line, and mBDSR signals
Blacksun Indicator (List)
https://www.gogojungle.co.jp/finance/navi/articles/33779
Free Blacksun indicators and free eBooks
https://www.gogojungle.co.jp/finance/navi/articles/90181
【Reference videos (RCI and mBDSR related)】
Bring together the scene using RCI for environmental recognition and multi-timeframe analysis to wait for a signal (1)
https://www.youtube.com/watch?v=1prvET_M5mA
Bring together the scene using RCI for environmental recognition and multi-timeframe analysis to wait for a signal (2)
https://www.gogojungle.co.jp/watch/1168
Bring together the scene using RCI for environmental recognition and multi-timeframe analysis to wait for a signal (3)
https://www.youtube.com/watch?v=C6DHn0lD-I4
Bring together the scene using RCI for environmental recognition and multi-timeframe analysis to wait for a signal (4)
https://www.youtube.com/watch?v=QG1iNTnLyyQ
Bring together the scene using RCI for environmental recognition and multi-timeframe analysis to wait for a signal (5)
https://www.youtube.com/watch?v=VYlGiy6Cllg
=================
【Master RCI!! Trend reversal, pullback buying, and bounce selling】
Indicator that delivers power in combination with RCI【BODSOR・mBDSR】
and methods / case studies (PDF) ★GogoJungle AWARD2020 winner★
https://www.gogojungle.co.jp/tools/indicators/11836
Euro-OZ EuroAUD 4-hour chart
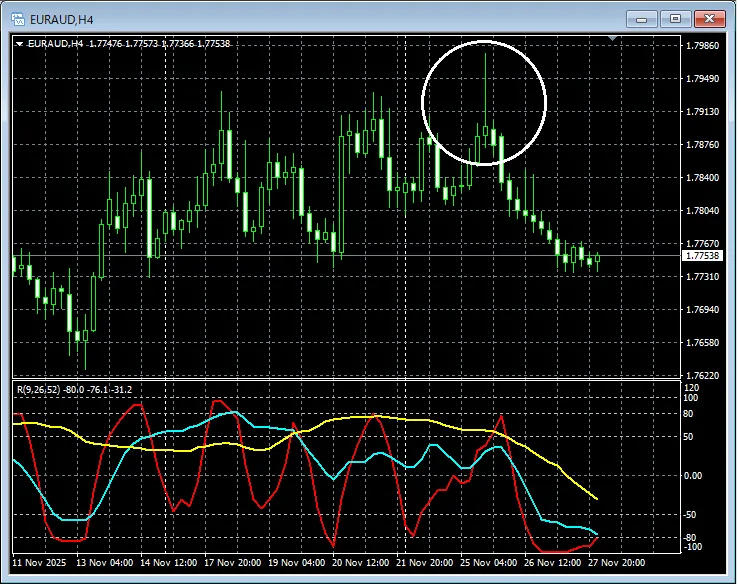
In the 4-hour chart above, a decline-reversal is suggestedLong upper-shadow pin barappears,RCI three-lineis in a very weak configuration.
Euro-Australia EURAUD 1-hour chart
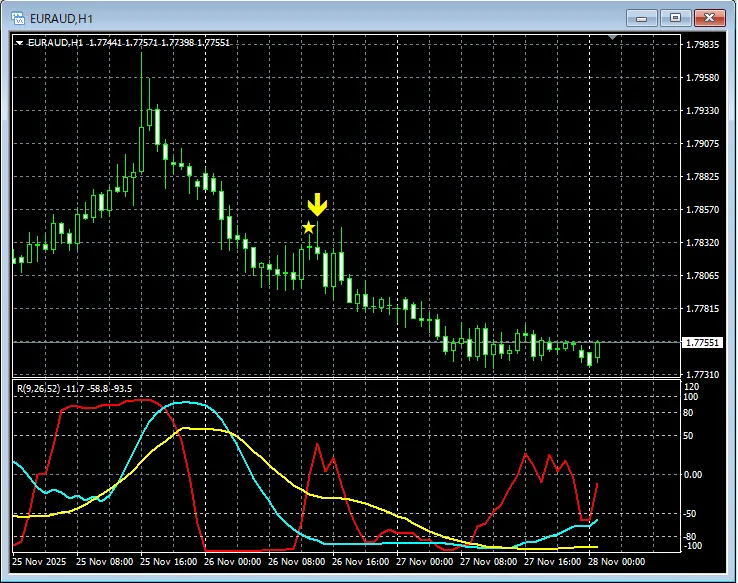
mBDSR (RCI two-line filter)signal
On the 4-hour chart,RCI three-lineis in a very weak state, and on the 1-hour chart,mBDSR (RCI two-line filter) signallights up and the price continues to move down.
Indicator that delivers power in combination with RCI【BODSOR・mBDSR】
and methods / case studies (PDF) ★GogoJungle AWARD2020 winner★
https://www.gogojungle.co.jp/tools/indicators/11836
More than 550 PDFs are included (methods / case studies: over 1,950 pages, over 690,000 words).
Many of themexplore multiple lower-timeframe conditions by logically linking higher and lower timeframes using the three-line RCI, ultimately arriving at a pattern of waiting for pullbacks or pullback selling in the lower timeframes (i.e., signals from mBDSR).This is compiled as examples.
Additionally,there are many that focus on capturing points where multiple entry justification lines up.There are also.
Note thatthere are methods to explore gains and downside targets using the three-line RCIas well.
In the PDF explanations,over 1,900 chartsare used.

× ![]()


