

【Master RCI and Capture Trend Reversals!!】 Today's USD/JPY chart mBDSR signal 6-minute chart
Blacksun Indicator (List)
https://www.gogojungle.co.jp/finance/navi/articles/33779
About Blacksun Free Indicators and Free E-Books
https://www.gogojungle.co.jp/finance/navi/articles/90181
【Reference videos (RCI and mbDSR related)】
Bring the environment recognition and multi-time frame analysis using RCI to the point of waiting for a signal (1)
https://www.youtube.com/watch?v=1prvET_M5mA
Bring the environment recognition and multi-time frame analysis using RCI to the point of waiting for a signal (2)
https://www.gogojungle.co.jp/watch/1168
Bring the environment recognition and multi-time frame analysis using RCI to the point of waiting for a signal (3)
https://www.youtube.com/watch?v=C6DHn0lD-I4
Bring the environment recognition and multi-time frame analysis using RCI to the point of waiting for a signal (4)
https://www.youtube.com/watch?v=QG1iNTnLyyQ
Bring the environment recognition and multi-time frame analysis using RCI to the point of waiting for a signal (5)
https://www.youtube.com/watch?v=VYlGiy6Cllg
=================
【Master RCI!! Trend Reversal, Buy on Dips, Sell on Rallies】
An indicator that shines in combination with RCI【BODSOR・mBDSR】
and the method・case studies (PDF) ★GogoJungle AWARD2020 Winner★
https://www.gogojungle.co.jp/tools/indicators/11836
USD/JPY 6-minute chart on MT5
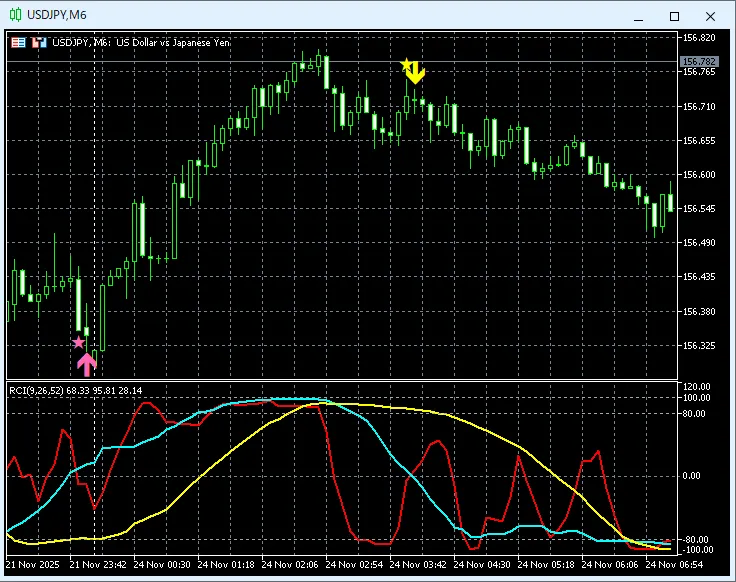
mBDSR (two RCI filters) Signal
On the above chart,the signal of mBDSR (two RCI filters)lights up at the right timing.
An indicator that shines in combination with RCI【BODSOR・mBDSR】
and the method・case studies (PDF) ★GogoJungle AWARD2020 Winner★
https://www.gogojungle.co.jp/tools/indicators/11836
More than 550 PDFs are included (methods・case studies: over 1,950 pages in total, over 690,000 characters).
Many of them aresummaries of using three RCI lines to logically link higher and lower timeframes, examining multiple lower-timeframe conditions in sequence, and ultimately waiting for dipping buys or pullbacks (i.e., mBDSR signals) in the lower timeframes..
Also,many focus on identifying points where multiple entry signals coincide..
In addition,there are methods to explore upside targets and downside targets using three RCI lines..
In the PDF explanations,more than 1,900 chartsare used.


