

【Master RCI and Capture Trend Reversals!!】Today's USD/JPY chart mBDSR signal 3-minute chart
Blacksun Indicator (List)
https://www.gogojungle.co.jp/finance/navi/articles/33779
Information on Blacksun Free Indicators and Free E-books
https://www.gogojungle.co.jp/finance/navi/articles/90181
【Reference Videos (RCI and mBDSR related)】
Bring the signs by using RCI for environmental recognition and multi-timeframe analysis (1)
https://www.youtube.com/watch?v=1prvET_M5mA
Bring the signs by using RCI for environmental recognition and multi-timeframe analysis (2)
https://www.gogojungle.co.jp/watch/1168
Bring the signs by using RCI for environmental recognition and multi-timeframe analysis (3)
https://www.youtube.com/watch?v=C6DHn0lD-I4
Bring the signs by using RCI for environmental recognition and multi-timeframe analysis (4)
https://www.youtube.com/watch?v=QG1iNTnLyyQ
Bring the signs by using RCI for environmental recognition and multi-timeframe analysis (5)
https://www.youtube.com/watch?v=VYlGiy6Cllg
=================
【Master RCI!! Trend Reversal, Buy on Dips, Sell on Rallies】
Indicator that shines in combination with RCI【BODSOR・mBDSR】
Method and Case Study (PDF) ★GogoJungle AWARD2020 Winner★
https://www.gogojungle.co.jp/tools/indicators/11836
USD/JPY 3-minute chart on MT5
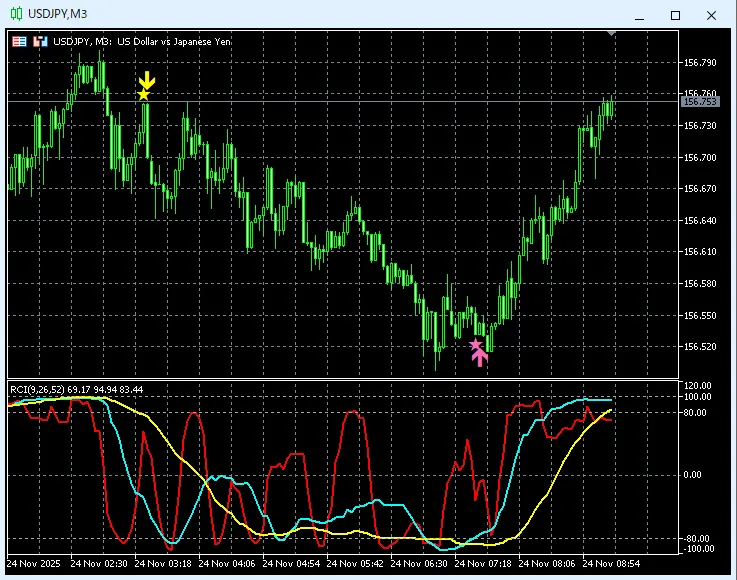
mBDSR (RCI two-line filter)Signal
In the chart above,the signal of mBDSR (RCI two-line filter)lights up timely.
Indicator that shines in combination with RCI【BODSOR・mBDSR】
Method and Case Study (PDF) ★GogoJungle AWARD2020 Winner★
https://www.gogojungle.co.jp/tools/indicators/11836
More than 550 PDF files (Methods and Case Studies: over 1,950 pages, over 690,000 characters) are included.
Most of them are summaries of examples where multiple lower-timeframe conditions are logically linked with higher timeframes using three RCI lines, ultimately waiting for buy on dips or sell on rallies on the lower timeframes (i.e., signals from mBDSR).
Also,many focus on capturing points where multiple entry justifications align.There are also works that explore exits using RCI three-line method.
In the PDF explanations,
over 1,900 charts are used.


