

【Master RCI to Precisely Catch Trend Reversals!!】Pound-Aussie 15-minute chart mBDSR signals
Blacksun Indicator (List)
https://www.gogojungle.co.jp/finance/navi/articles/33779
Blacksun Free Indicators and Free eBooks
https://www.gogojungle.co.jp/finance/navi/articles/90181
【Reference Videos (RCI and mBDSR related)】
Bring together the environment recognition and multi-time-frame analysis using RCI to wait for a signal (1)
https://www.youtube.com/watch?v=1prvET_M5mA
Bring together the environment recognition and multi-time-frame analysis using RCI to wait for a signal (2)
https://www.gogojungle.co.jp/watch/1168
Bring together the environment recognition and multi-time-frame analysis using RCI to wait for a signal (3)
https://www.youtube.com/watch?v=C6DHn0lD-I4
Bring together the environment recognition and multi-time-frame analysis using RCI to wait for a signal (4)
https://www.youtube.com/watch?v=QG1iNTnLyyQ
Bring together the environment recognition and multi-time-frame analysis using RCI to wait for a signal (5)
https://www.youtube.com/watch?v=VYlGiy6Cllg
=================
【Mastering RCI!! Trend Reversal, Dip Buying, and Retracement Selling】
An indicator that shines when used in combination with RCI【BODSOR・mBDSR】
and Method / Case Studies (PDF) ★GogoJungle AWARD2020 Winner★
https://www.gogojungle.co.jp/tools/indicators/11836
Pound/Australia Dollar GBP/AUD 15-minute chart
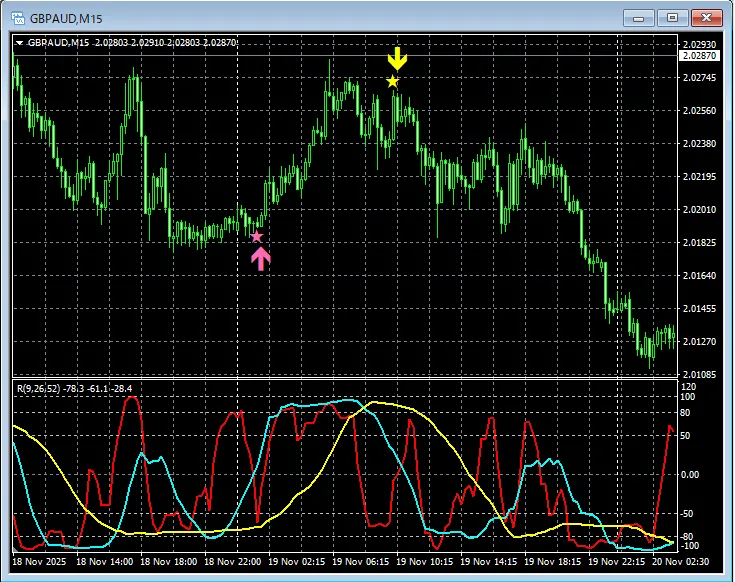
mBDSR (RCI two-line filter)Signal
In the above chart,mBDSR (RCI two-line filter) signalis lighting up at the right timing.
An indicator that shines when used in combination with RCI【BODSOR・mBDSR】
and Method / Case Studies (PDF) ★GogoJungle AWARD2020 Winner★
https://www.gogojungle.co.jp/tools/indicators/11836
More than 550 PDF files (Methods / Case Studies: over 1,950 pages, over 690,000 characters) are included.
Many of them aresummaries of cases where multiple timeframes are logically linked by using three RCI lines to examine the conditions on higher and lower timeframes step by step, ultimately waiting for a dip-buy or retracement-sell signal on the lower timeframes (i.e., the mBDSR signal)..
Also,many are focused on identifying points where multiple entry reasons align..
Additionally,there are methods that explore upside targets and downside targets using three RCI lines..
In the PDF explanations,more than 1,900 chartsare used.

× ![]()


