

Battle-hardened【Mastering RCI to win with Moving Average Filter!!】Yesterday's Nikkei Average JP225 5-minute chart mBDSR dip-buy signal
Blacksun Indicator (List)
https://www.gogojungle.co.jp/finance/navi/articles/33779
Blacksun Free Indicators and Free E-books
https://www.gogojungle.co.jp/finance/navi/articles/90181
【Reference Videos (RCI and mBDSR related)】
Bring the environment recognition and multi-time-frame analysis to the point of waiting for the signal using RCI (1)
https://www.youtube.com/watch?v=1prvET_M5mA
Bring the environment recognition and multi-time-frame analysis to the point of waiting for the signal using RCI (2)
https://www.gogojungle.co.jp/watch/1168
Bring the environment recognition and multi-time-frame analysis to the point of waiting for the signal using RCI (3)
https://www.youtube.com/watch?v=C6DHn0lD-I4
Bring the environment recognition and multi-time-frame analysis to the point of waiting for the signal using RCI (4)
https://www.youtube.com/watch?v=QG1iNTnLyyQ
Bring the environment recognition and multi-time-frame analysis to the point of waiting for the signal using RCI (5)
https://www.youtube.com/watch?v=VYlGiy6Cllg
=================
【Mastering RCI!! Trend Reversal, Buy on Dips, Sell on Rallies】
Indicators that shine when combined with RCI【BODSOR・mBDSR】
and Methods & Case Studies (PDF) ★GogoJungle AWARD2020 winner★
https://www.gogojungle.co.jp/tools/indicators/11836
※This product【BODSOR・mBDSR】includes more than 550 PDFs as methods & case studies (totaling over 1,950 pages, over 1,900 charts, and over 690,000 words).
mBDSR (RCI Filter)andmBDSR (Moving Average Filter)have different roles. The accompanying PDF also discusses how to use them.
mBDSR (Moving Average Filter)For the file name and title of the PDFs that explain it, please refer to the following Investment Navi+ article.
【Master RCI!!】Summary of PDFs explaining mBDSR (Moving Average Filter)
https://www.gogojungle.co.jp/finance/navi/articles/90127
Below, we introduce examples of signals formBDSR (Moving Average Filter)signals.
Nikkei Average JP225 5-minute chart
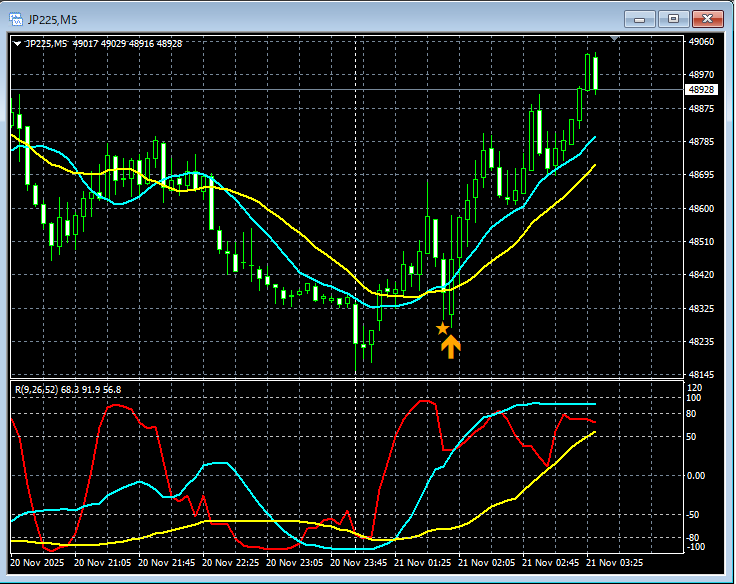
In the chart above,the buy-on-dip signal of the moving average filter mBDSRlights up at the right timing.
In the case of the moving-average-filtered mBDSRas well,using it in conjunction with the upper-timeframe down to the lower-timeframe drop using the three RCI linesenables high-probability trades. This is also explained in theaccompanying PDF.
※ Note: For ease of explanation, charts in this article may include circles, lines, or rectangles.
Indicato rs that shine when combined with RCI【BODSOR・mBDSR】
and Methods & Case Studies (PDF) ★GogoJungle AWARD2020 winner★
https://www.gogojungle.co.jp/tools/indicators/11836
Includes over 550 PDF files (Methods & Case Studies: over 1,950 pages, over 690,000 words).
Most of them are about linking higher and lower timeframes logically using three RCIs, then examining multiple lower-timeframe conditions sequentially, and ultimately waiting for a dip or pullback timing on the lower timeframe (i.e., the mBDSR signal).
Additionally,many emphasize capturing points where multiple entry reasons coincide.There are also many that explore methods to assess ascent or descent targets using the three RCI lines.
In the PDF explanations,
over 1,900 chartsare used.


