

Battle-hardened【Mastering RCI to win with moving average filter!!】Yesterday's USD/JPY 30-minute chart mBDSR pullback sell signal
Blacksun Indicator (List)
https://www.gogojungle.co.jp/finance/navi/articles/33779
About Blacksun Free Indicators and Free E-Books
https://www.gogojungle.co.jp/finance/navi/articles/90181
【Reference Videos (RCI and mBDSR related)】
Bring the signals to a wait-for-signal stage using environment recognition with RCI and multi-timeframe analysis (1)
https://www.youtube.com/watch?v=1prvET_M5mA
Bring the signals to a wait-for-signal stage using environment recognition with RCI and multi-timeframe analysis (2)
https://www.gogojungle.co.jp/watch/1168
Bring the signals to a wait-for-signal stage using environment recognition with RCI and multi-timeframe analysis (3)
https://www.youtube.com/watch?v=C6DHn0lD-I4
Bring the signals to a wait-for-signal stage using environment recognition with RCI and multi-timeframe analysis (4)
https://www.youtube.com/watch?v=QG1iNTnLyyQ
Bring the signals to a wait-for-signal stage using environment recognition with RCI and multi-timeframe analysis (5)
https://www.youtube.com/watch?v=VYlGiy6Cllg
=================
【Master RCI!! Trend Reversal, Buy on Dips, Sell on Retracements】
Indicators that unleash power when paired with RCI【BODSOR・mBDSR】
and methods and case studies (PDF) ★GogoJungle AWARD2020 Winner★
https://www.gogojungle.co.jp/tools/indicators/11836
※This product【BODSOR・mBDSR】includes over 550 PDFs (methods and case studies; totaling over 1,950 pages, over 1,900 chart images, and over 690,000 words) as attachments.
mBDSR (RCI Filter)andmBDSR (Moving Average Filter)have different roles. The accompanying PDFs also discuss how to use them distinctly.
mBDSR (Moving Average Filter)For the file name and title of the PDFs that explain this, please refer to the Investment Navi+ article below.
【Mastering RCI!!】Summary of PDFs Explaining mBDSR (Moving Average Filter)
https://www.gogojungle.co.jp/finance/navi/articles/90127
Below, we introduce examples of signals formBDSR (Moving Average Filter)signals.
USD/JPY 30-minute chart
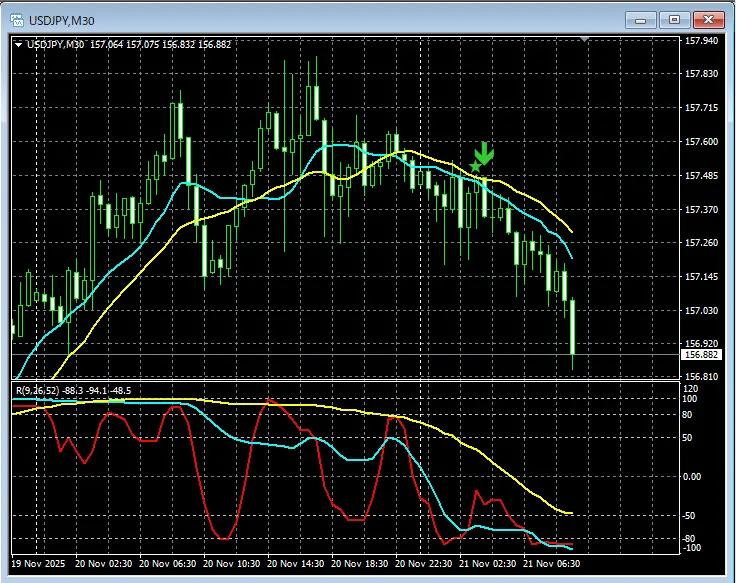
In the chart above,the sell signal from the mBDSR (Moving Average Filter) and its retrace are lighting up at the right timing.
In the case of the Moving Average Filter mBDSRas wellby incorporating the consolidation from higher to lower time frames using the three RCI linesyou can achieve higher-probability trades. This is also explained in theattached PDF.
※ Please note that for brevity, some charts in this article include added circles, lines, or rectangles for explanation.
Indicators that unleash power when paired with RCI: 【BODSOR・mBDSR】
and methods and case studies (PDF) ★GogoJungle AWARD2020 Winner★
https://www.gogojungle.co.jp/tools/indicators/11836
Over 550 PDFs (methods and case studies: totaling over 1,950 pages and over 690,000 words) are included.
Many of these are designed to logically link higher and lower time frames using the three RCI lines, then review the multiple lower-time-frame conditions in sequence, ultimately waiting for a dip-buy or pullback-sell timing (i.e., the mBDSR signal) on the lower time frame.
Additionally,there are many resources focusing on identifying points where multiple entry reasons align..
Moreover,this also includes methods to explore upside and downside targets using the three RCI lines..
In the PDFs,over 1,900 chartsare used.


