

【Master RCI to the extreme and win!!】Yesterday's USD/JPY 1-minute chart Double top, neck line, and mBDSR signals
Blacksun Indicator (List)
https://www.gogojungle.co.jp/finance/navi/articles/33779
Free Blacksun indicators and free e-books
https://www.gogojungle.co.jp/finance/navi/articles/90181
【Reference videos (RCI and mbDSR related)】
Bring into a state of environment recognition and multi-timeframe analysis using RCI to await a signal (1)
https://www.youtube.com/watch?v=1prvET_M5mA
Bring into a state of environment recognition and multi-timeframe analysis using RCI to await a signal (2)
https://www.gogojungle.co.jp/watch/1168
Bring into a state of environment recognition and multi-timeframe analysis using RCI to await a signal (3)
https://www.youtube.com/watch?v=C6DHn0lD-I4
Bring into a state of environment recognition and multi-timeframe analysis using RCI to await a signal (4)
https://www.youtube.com/watch?v=QG1iNTnLyyQ
Bring into a state of environment recognition and multi-timeframe analysis using RCI to await a signal (5)
https://www.youtube.com/watch?v=VYlGiy6Cllg
=================
【Master RCI!! Trend reversal, buying on dips, selling on rallies】
Indicators that excel in combination with RCI【BODSOR・mbDSR】
and methods/case studies (PDF) ★GogoJungle AWARD2020 winner★
https://www.gogojungle.co.jp/tools/indicators/11836
USD/JPY 1-minute chart
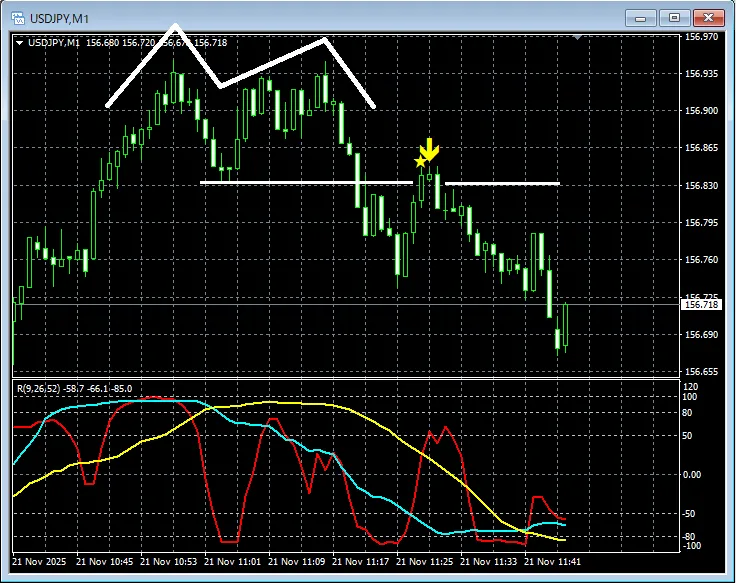
mbDSR (RCI two-line filter)Signals
On the above chart,near the neck line of the double topreturning to that areambDSR (RCI two-line filter) signalslight up at the right timing.
Indicators that excel in combination with RCI【BODSOR・mbDSR】
and methods/case studies (PDF) ★GogoJungle AWARD2020 winner★
https://www.gogojungle.co.jp/tools/indicators/11836
More than 550 PDF files are included (methods and case studies: over 1,950 pages, over 690,000 characters).
Many of them areexamples where three RCI lines logically link higher and lower timeframes to sequentially consider multiple lower timeframes, ultimately waiting for a dip/buying opportunity or rally selling timing (i.e., mbDSR signals) on the lower timeframe..
Additionally,there are many that focus on identifying points where multiple entry reasons overlap..
Also included is a method for exploring upside and downside targets using three RCI lines.
In the PDF explanations,more than 1,900 chartsare used.

× ![]()


