

【Master RCI to Win!!】 Signaling Buy Trigger, Fibonacci, and mBDSR on AUD/JPY 15-minute chart
Blacksun Indicators (List)
https://www.gogojungle.co.jp/finance/navi/articles/33779
About Blacksun Free Indicators and Free eBooks
https://www.gogojungle.co.jp/finance/navi/articles/90181
【Reference video (RCI and mBDSR related)】
Bring the environment recognition and multi-timeframe analysis to the point of waiting for signals using RCI (1)
https://www.youtube.com/watch?v=1prvET_M5mA
Bring the environment recognition and multi-timeframe analysis to the point of waiting for signals using RCI (2)
https://www.gogojungle.co.jp/watch/1168
Bring the environment recognition and multi-timeframe analysis to the point of waiting for signals using RCI (3)
https://www.youtube.com/watch?v=C6DHn0lD-I4
Bring the environment recognition and multi-timeframe analysis to the point of waiting for signals using RCI (4)
https://www.youtube.com/watch?v=QG1iNTnLyyQ
Bring the environment recognition and multi-timeframe analysis to the point of waiting for signals using RCI (5)
https://www.youtube.com/watch?v=VYlGiy6Cllg
=================
【Mastering RCI!! Trend Reversal, Buying Dips, and Sell-offs】
An indicator that shines when combined with RCI【BODSOR・mBDSR】
and methods・case studies (PDF) ★GogoJungle AWARD2020 winner★
https://www.gogojungle.co.jp/tools/indicators/11836
AUDJPY 15-minute chart
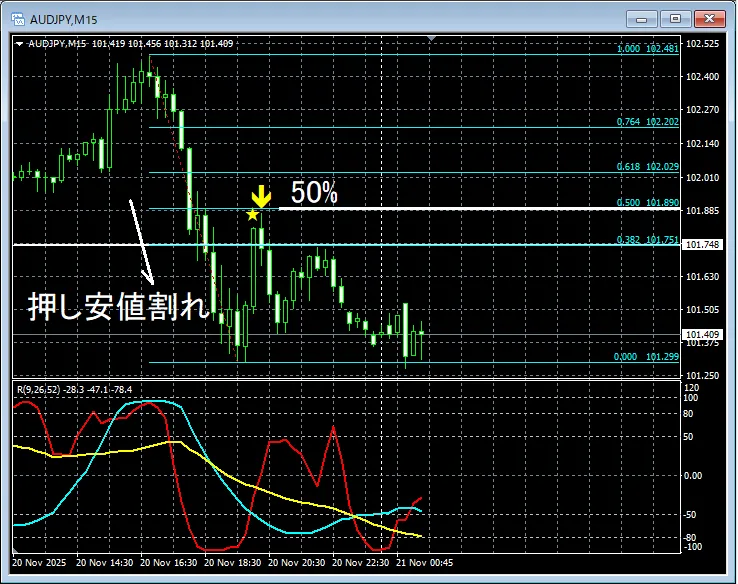
mBDSR (RCI two-filter)signal,Fibonacci retracement
Break of a near-term low(the uptrend is temporarily negated).
→ Then,Fibonacci retracementto50%retracement.
→mBDSR’s sell-on-rack signallights up and it moves down.
An indicator that shines when combined with RCI【BODSOR・mBDSR】
and methods・case studies (PDF) ★GogoJungle AWARD2020 winner★
https://www.gogojungle.co.jp/tools/indicators/11836
More than 550 PDF files (methods・case studies: total over 1,950 pages, over 690,000 characters) are included.
Most of them aresummaries of examples where, by logically linking higher and lower timeframes using three RCI lines, multiple lower-timeframe conditions are examined sequentially, ultimately waiting for dip buys or pullbacks on the lower timeframes (i.e., the mBDSR signal)..
Additionally,many focus on catching points where multiple entry reasons overlap..
Note that,it also includes methods to explore ascent and decline targets using three RCI lines..
In the PDF explanations,more than 1,900 chartsare used.

× ![]()


