

Battle-hardened expert 【Mastering RCI to win!!】 Sign of R1R2S2 Nikkei 225 30-minute chart
Blacksun Indicators (List)
https://www.gogojungle.co.jp/finance/navi/articles/33779
About Blacksun's Free Indicators and Free eBooks
https://www.gogojungle.co.jp/finance/navi/articles/90181
【Reference videos (RCI and mBDSR related)】
Bring a signal through environment recognition and multi-time-frame analysis using RCI (1)
https://www.youtube.com/watch?v=1prvET_M5mA
Bring a signal through environment recognition and multi-time-frame analysis using RCI (2)
https://www.gogojungle.co.jp/watch/1168
Bring a signal through environment recognition and multi-time-frame analysis using RCI (3)
https://www.youtube.com/watch?v=C6DHn0lD-I4
Bring a signal through environment recognition and multi-time-frame analysis using RCI (4)
https://www.youtube.com/watch?v=QG1iNTnLyyQ
Bring a signal through environment recognition and multi-time-frame analysis using RCI (5)
https://www.youtube.com/watch?v=VYlGiy6Cllg
=================
【Master RCI!! Trend Reversal, Buy on Dips, Sell on Rallies】
Indicators that shine in combination with RCI: 【BODSOR・mBDSR】
Methods and Case Studies (PDF) ★Winner of GogoJungle AWARD 2020★
https://www.gogojungle.co.jp/tools/indicators/11836
R1R2S2is included in the above product. For details, please read the investment Navi+ article below.
RCI 3-line ‘2-stage confirmation’ for Trend Reversal, Buy on Dips, Sell on Rallies — R1R2S2 Release!!
※ This product 【BODSOR・mBDSR】 includes, in addition to the above, 358 PDFs as methods/case studies (total over 1,400 pages, over 1,350 charts, over 470,000 words).
※ In addition to the PDFs above, 31 PDFs (methods/case studies: over 120 pages, over 115 charts, over 40,000 words) are included to effectively utilize R1R2S2.
PDF Collection for Effectively Utilizing R1R2S2【Master RCI!!】
https://www.gogojungle.co.jp/finance/navi/articles/93154
Please see the investment Navi+ article above for the file names and titles of the PDFs to effectively utilize R1R2S2.
Below, we introduce examples of signals forR1R2S2.
Nikkei 225 30-minute chart
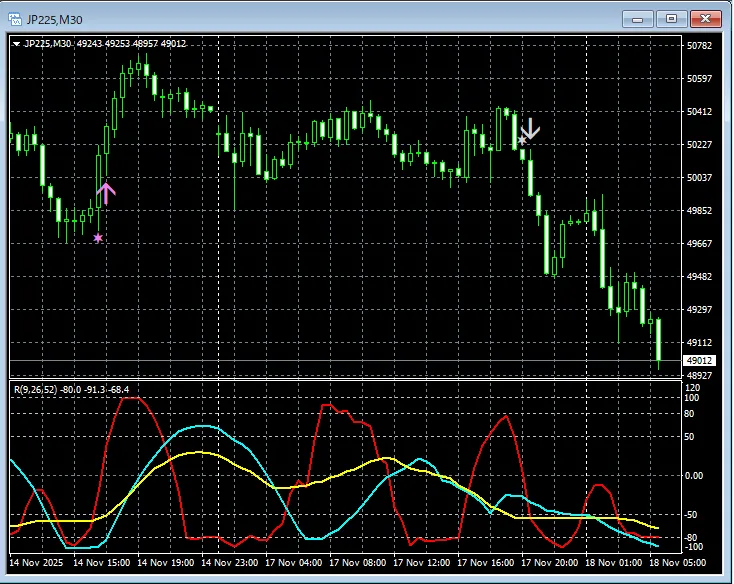
R1R2S2signals
On the above chart,R1R2S2 signalslight up at the right timing.
Signals of mBDSRare being waited for,mBDSR signalsdid not light up, or were missed or late,R1R2S2 signalscan address it, andR1R2S2is often used together withmBDSR.
The indicator that shines in combination with RCI: 【BODSOR・mBDSR】
and the methods and case studies (PDF) ★GogoJungle AWARD 2020★
https://www.gogojungle.co.jp/tools/indicators/11836
Includes over 550 PDF files (methods/case studies: over 1,950 pages, over 690,000 words).
Many of these areexamples that analyze multiple lower-timeframe situations logically by linking the higher and lower timeframes using the three RCI lines, ultimately waiting for a dipping buy or rally selling timing (the signal of mBDSR) on the lower timeframes..
Also,many are focused on capturing points where multiple entry confirmations converge..
Also included is a method to explore upward and downward targets using the three RCI lines.
In the PDF explanations,over 1,900 chartsare used.


