

Master RCI to the extreme!! Signals of breakdown of support price, Fibonacci, pin bar, and mBDSR: AUDJPY 1-hour
Blacksun Indicator (List)
https://www.gogojungle.co.jp/finance/navi/articles/33779
Blacksun's Free Indicators and Free E-Books
https://www.gogojungle.co.jp/finance/navi/articles/90181
【Reference Videos (RCI and mBDSR related)】
Bring into a setup waiting for a signal with market environment recognition using RCI and multi-time frame analysis (1)
https://www.youtube.com/watch?v=1prvET_M5mA
Bring into a setup waiting for a signal with market environment recognition using RCI and multi-time frame analysis (2)
https://www.gogojungle.co.jp/watch/1168
Bring into a setup waiting for a signal with market environment recognition using RCI and multi-time frame analysis (3)
https://www.youtube.com/watch?v=C6DHn0lD-I4
Bring into a setup waiting for a signal with market environment recognition using RCI and multi-time frame analysis (4)
https://www.youtube.com/watch?v=QG1iNTnLyyQ
Bring into a setup waiting for a signal with market environment recognition using RCI and multi-time frame analysis (5)
https://www.youtube.com/watch?v=VYlGiy6Cllg
=================
【Mastering RCI!! Trend Reversals, Buy the Dip, Sell on Retracements】
Indicator that shines in combination with RCI: 【BODSOR・mBDSR】
Methods and case studies (PDF) ★GogoJungle AWARD2020 winner★
https://www.gogojungle.co.jp/tools/indicators/11836
AUD/JPY 1-hour
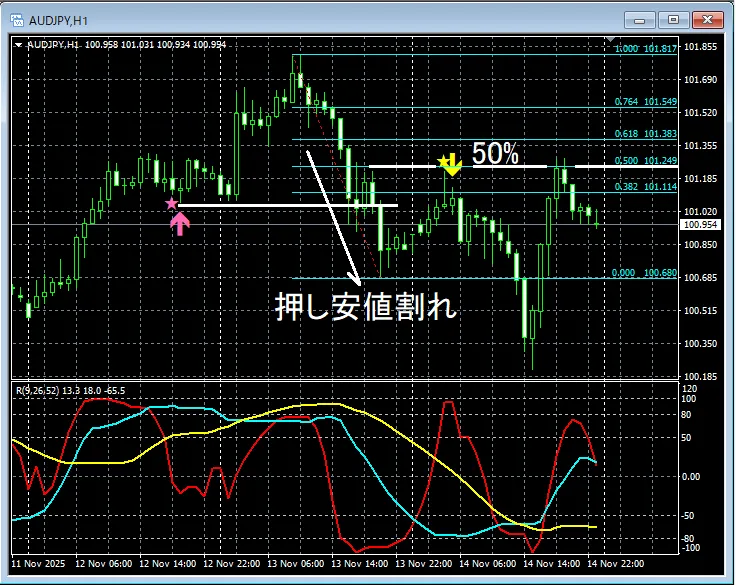
mBDSR (Two RCI filters)signals,Fibonacci Retracement
mBDSR Buy-the-dip signalsignite and rise.
→ Pullback,Broken support (uptrend temporarily negated).
→ Subsequently,Fibonacci Retracementto50% retracement.
→ Indicates a potential declineLong upper shadow pin barappears.
→mBDSR retracement sell signallights up and prices fall.
Indicator that shines in combination with RCI【BODSOR・mBDSR】
Methods and case studies (PDF) ★GogoJungle AWARD2020 winner★
https://www.gogojungle.co.jp/tools/indicators/11836
More than 550 PDF files (Methods and case studies: over 1,950 pages, over 690,000 words) are included.
Many of them are examples that logically link higher and lower timeframes using three RCI lines to progressively assess multiple lower timeframes, ultimately waiting for a dip-buy or pullback sell timing on the lower timeframes (i.e., a signal from mBDSR)..
Also, many pieces focus on capturing points where multiple entry reasons coincide..
Additionally, there are methods that explore upside and downside targets using three RCI lines..
In the PDF explanations, more than 1,900 charts are used.

× ![]()


