

[Master RCI!!] Pin Bar, 2B Reversal, and Evening Star and mBDSR Signals AUD/JPY 4-minute chart
Blacksun Indicator (List)
https://www.gogojungle.co.jp/finance/navi/articles/33779
Free Blacksun Indicators and Free E-Books
https://www.gogojungle.co.jp/finance/navi/articles/90181
【Reference Videos (RCI and mbDSR related)】
Environment recognition using RCI and multi-time frame analysis to bring it to a pattern waiting for a signal (1)
https://www.youtube.com/watch?v=1prvET_M5mA
Environment recognition using RCI and multi-time frame analysis to bring it to a pattern waiting for a signal (2)
https://www.gogojungle.co.jp/watch/1168
Environment recognition using RCI and multi-time frame analysis to bring it to a pattern waiting for a signal (3)
https://www.youtube.com/watch?v=C6DHn0lD-I4
Environment recognition using RCI and multi-time frame analysis to bring it to a pattern waiting for a signal (4)
https://www.youtube.com/watch?v=QG1iNTnLyyQ
Environment recognition using RCI and multi-time frame analysis to bring it to a pattern waiting for a signal (5)
https://www.youtube.com/watch?v=VYlGiy6Cllg
=================
【Mastering RCI!! Trend Reversal, Buy on Dips, Sell on Rallies】
An indicator that shines in combination with RCI 【BODSOR・mBDSR】
and methods / case studies (PDF) ★GogoJungle AWARD2020 Winner★
https://www.gogojungle.co.jp/tools/indicators/11836
AUDJPY on the 1-hour MT5 chart
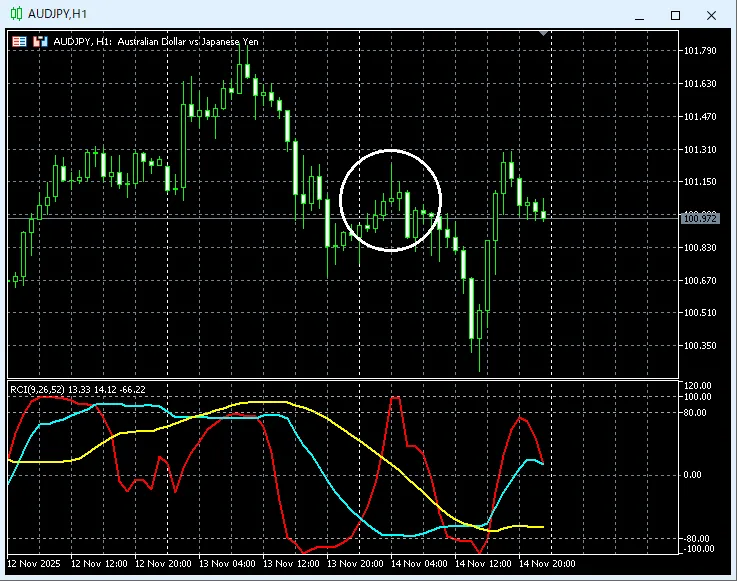
A long upper wick Pin Barappears.
AUDJPY on the 30-minute MT5 chart
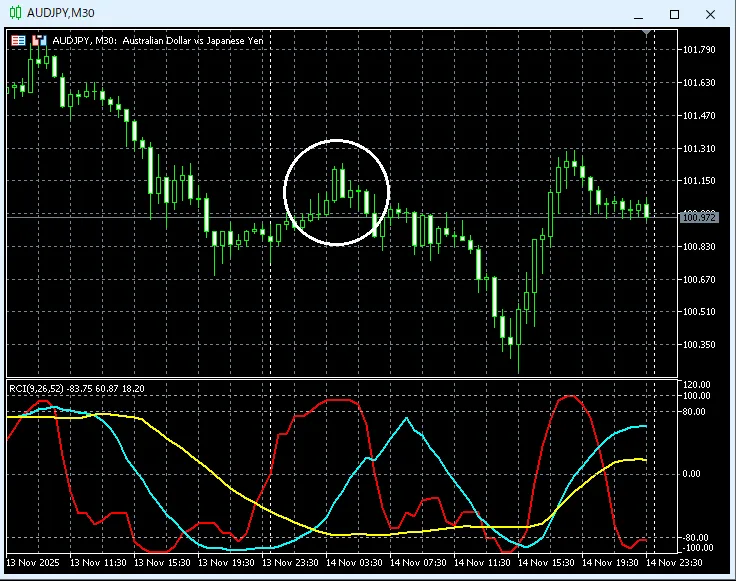
2B Reversalappears.
AUDJPY on the 20-minute MT5 chart
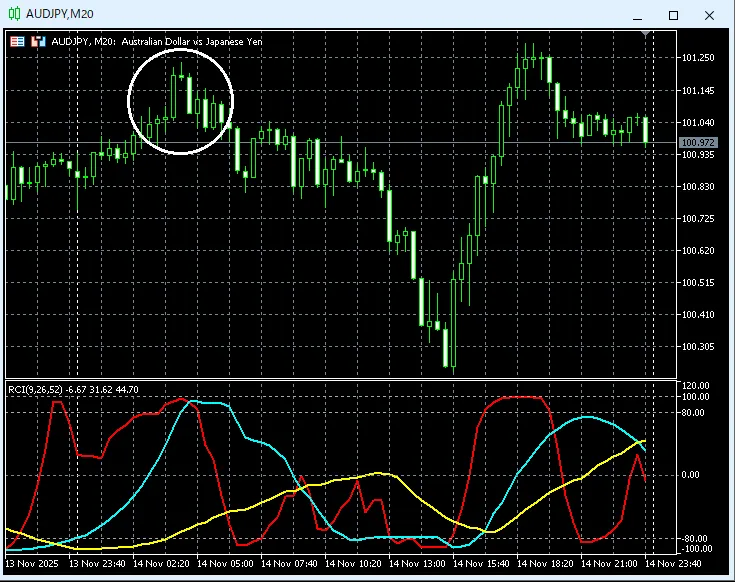
Evening Star (Sakata's Five Methods)appears.
AUDJPY on the 4-minute MT5 chart
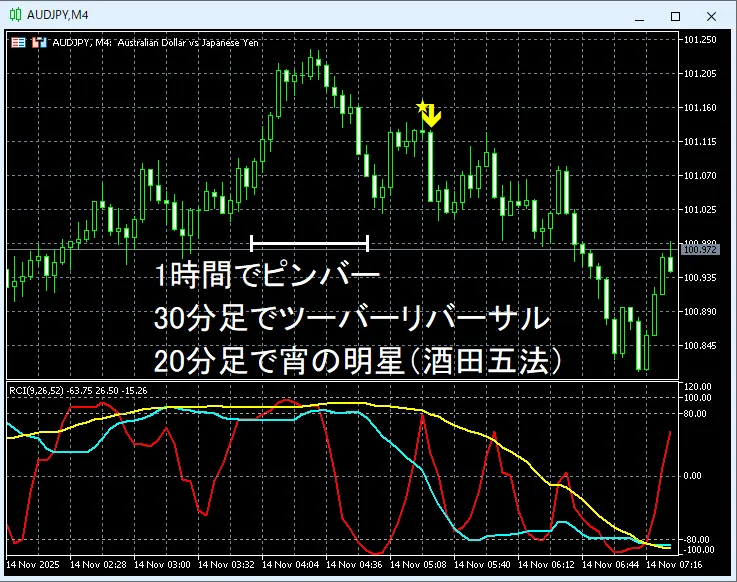
mBDSR (RCI two-filter)signal
After a candlestick pattern that suggests a downtrend on the higher time frame appears,the mBDSR (RCI two-filter) short selling signallights up and trends lower steadily.
An indicator that shines in combination with RCI【BODSOR・mBDSR】
and methods / case studies (PDF) ★GogoJungle AWARD2020 Winner★
https://www.gogojungle.co.jp/tools/indicators/11836
More than 550 PDF files (methods & case studies: over 1,950 pages, over 690,000 words) are included.
Most of them areexamples that lay out the pattern of using three RCI lines to logically link higher and lower time frames, then sequentially analyze multiple lower time frames, and finally wait for a dip buying or pullback selling timing (the signals of mBDSR) on the lower time frame..
Also,many are focused on capturing points where multiple entry reasons overlap..
Additionally,there are methods to explore upside/downside targets using three RCI lines..
In the PDF explanations,there are over 1,900 charts used..

× ![]()


