

Master RCI to Win!! Double Top and mBDSR Signals USD/JPY 2-minute Chart
Blacksun Indicators (List)
https://www.gogojungle.co.jp/finance/navi/articles/33779
About Blacksun's Free Indicators and Free E-Books
https://www.gogojungle.co.jp/finance/navi/articles/90181
【Reference Videos (RCI and mBDSR related)】
Carrying environment recognition and multi-timeframe analysis using RCI to wait for a signal (1)
https://www.youtube.com/watch?v=1prvET_M5mA
Carrying environment recognition and multi-timeframe analysis using RCI to wait for a signal (2)
https://www.gogojungle.co.jp/watch/1168
Carrying environment recognition and multi-timeframe analysis using RCI to wait for a signal (3)
https://www.youtube.com/watch?v=C6DHn0lD-I4
Carrying environment recognition and multi-timeframe analysis using RCI to wait for a signal (4)
https://www.youtube.com/watch?v=QG1iNTnLyyQ
Carrying environment recognition and multi-timeframe analysis using RCI to wait for a signal (5)
https://www.youtube.com/watch?v=VYlGiy6Cllg
=================
【Mastering RCI!! Trend Reversal, Buy on Dips, Sell on Rallies】
Indicators that unleash power in combination with RCI【BODSOR・mBDSR】
and methodologies / case studies (PDF) ★GogoJungle AWARD2020 Winner★
https://www.gogojungle.co.jp/tools/indicators/11836
USDJPY, 2-minute chart, from MT5
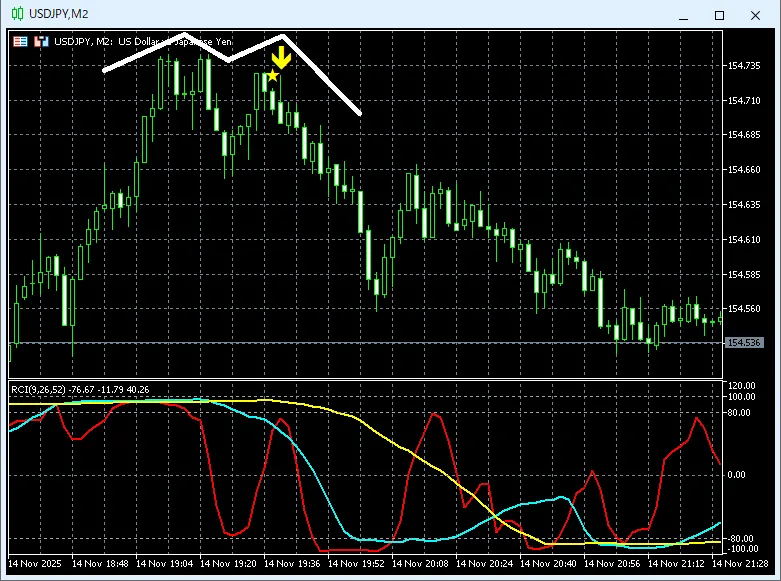
mBDSR (RCI double-filter)Signal
On the above chart, the following intuition emerges:Double topThe timing to start the decline is well captured on the right peak bythe signal of mBDSR (RCI double-filter).
Indicators that unleash power in combination with RCI【BODSOR・mBDSR】
and methodologies / case studies (PDF) ★GogoJungle AWARD2020 Winner★
https://www.gogojungle.co.jp/tools/indicators/11836
More than 550 PDF files (methods / case studies: over 1,950 pages in total, over 690,000 characters) are included.
Many of them are designed to link higher and lower timeframes logically using three RCI lines, systematically considering the conditions of multiple lower timeframes, and ultimately waiting for the dip buy or rally sell timing on the lower timeframe (i.e., the signal of mBDSR).
Additionally,many focus on pinpointing points where multiple entry reasons overlap..
Furthermore,there are methods that explore price targets using three RCI lines..
In the PDF explanations,more than 1,900 chartsare used.

× ![]()


