

Targeting the Third Wave!! Signals from RCI, Support at the Low, Fibonacci, and mBDSR Gold XAUUSD 1-hour chart
Blacksun Indicator (List)
https://www.gogojungle.co.jp/finance/navi/articles/33779
About Blacksun's Free Indicators and Free E-books
https://www.gogojungle.co.jp/finance/navi/articles/90181
【Reference Videos (RCI and mbDSR related)】
Bring the environment recognition and multi-time-frame analysis using RCI to the point of waiting for a signal (1)
https://www.youtube.com/watch?v=1prvET_M5mA
Bring the environment recognition and multi-time-frame analysis using RCI to the point of waiting for a signal (2)
https://www.gogojungle.co.jp/watch/1168
Bring the environment recognition and multi-time-frame analysis using RCI to the point of waiting for a signal (3)
https://www.youtube.com/watch?v=C6DHn0lD-I4
Bring the environment recognition and multi-time-frame analysis using RCI to the point of waiting for a signal (4)
https://www.youtube.com/watch?v=QG1iNTnLyyQ
Bring the environment recognition and multi-time-frame analysis using RCI to the point of waiting for a signal (5)
https://www.youtube.com/watch?v=VYlGiy6Cllg
=================
【Mastering RCI!! Trend Reversal, Buy on Dips, Sell on Rallies】
An indicator that shines in combination with RCI: BODSOR and mbDSR
and methodology / case studies (PDF) ★GogoJungle AWARD2020 winner★
https://www.gogojungle.co.jp/tools/indicators/11836
Gold XAUUSD 1-hour chart
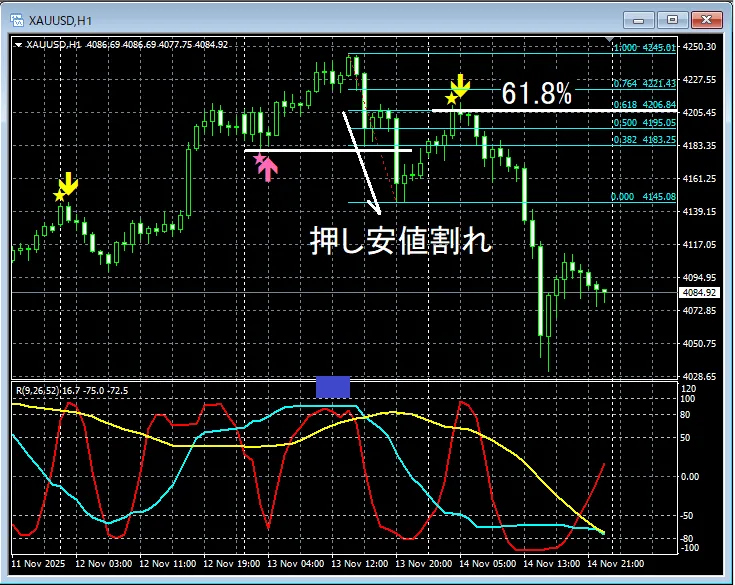
mbDSR (Two RCI filters)signal,Fibonacci retracement
First, the so-calleddouble top on RCI(around the blue square) rises and then falls.Pullback lowbreaks (temporary denial of uptrend). Then,Fibonacci retracementto61.8%retracementmbDSR sell signallights up and prices go down.
Gold XAUUSD 1-hour chart
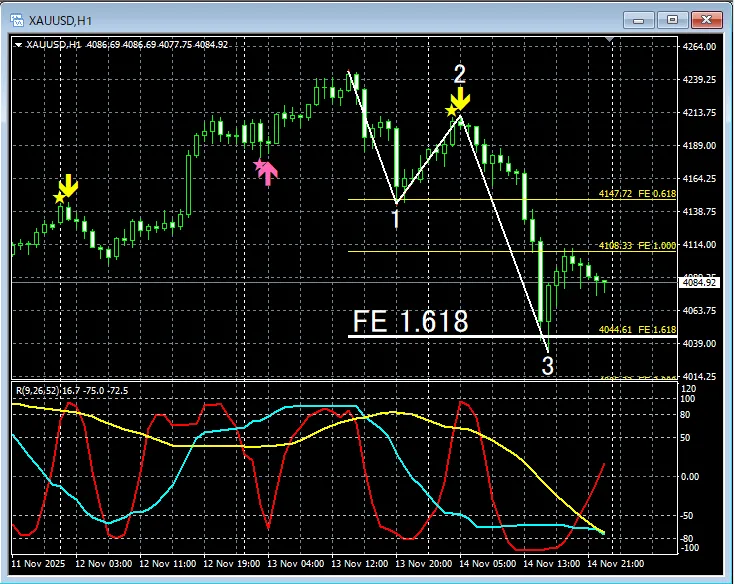
mbDSR (Two RCI filters)signal,Fibonacci expansion
Third wave.Fibonacci expansiontoaround 1.718and continues downward.
An indicator that shines in combination with RCI: BODSOR and mbDSR
and methodology / case studies (PDF) ★GogoJungle AWARD2020 winner★
https://www.gogojungle.co.jp/tools/indicators/11836
More than 550 PDF files (method and case studies: total over 1,950 pages, over 690,000 characters) are included.
Many of themdocument how to logically link higher and lower timeframes using RCI’s 3-line setup, examining multiple lower timeframes step by step, and ultimately waiting for a dip-buy or pullback sell signal on the lower timeframe (mbDSR signal)..
Additionally,there are many that emphasize capturing points where multiple entry signals align..
Furthermore,there are methods that explore upside and downside targets using three RCI lines..
In the PDF explanations,more than 1,900 chartsare used.

× ![]()


